
By Rajan Raju, Ravi Saraogi
A retirement plan spans decades, starting with an accumulating stage and ending with a distribution phase. And the journey isn’t smooth. The SWR methodology may help navigate the unforeseen twists and turns.
Retirement planning is a difficult exercise. Unlike planning for financial goals, where expenditure is incurred for a short period of time, a retirement corpus must last decades. This means the typical present value-future value (PV-FV) framework can be awfully wrong in retirement planning. A completely different approach is required to get things right.
Our detailed study offering an alternative approach using safe withdrawal rates (SWR) can be downloaded from here. Below, we summarise our study and discuss the key findings.
Let us take the case of an individual who is 40 years old and expects to retire by 60. Her current monthly expenditure is INR1 lakh, and she expects an inflation of 6% each year. The portfolio return is projected at 12% each year, and the life expectancy at 90 years. Based on this configuration, a simple application of PV-FV will yield the required retirement corpus at the age of 60 to be INR5.4 crore. Any online retirement calculator worth its salt can calculate this for you.
In an excel spreadsheet, this retirement plan works great. As you can see in the chart below, the retirement corpus starts at about INR5.4 crore in 2043.
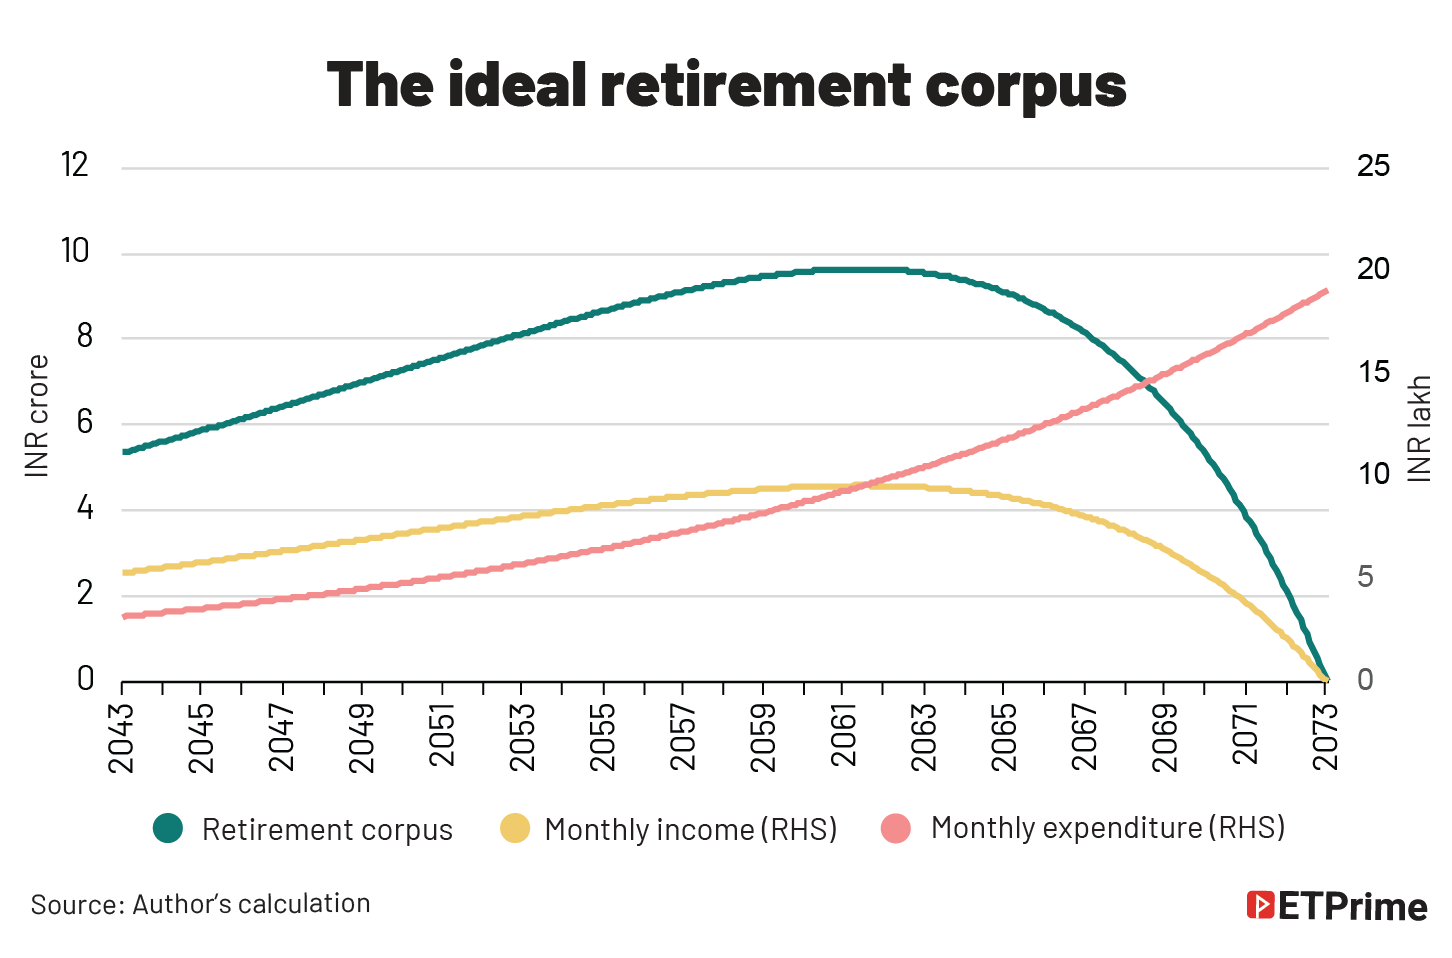
In the initial years, the income from retirement portfolio more than offsets the expenditure, which is increasing at the rate of inflation. But there comes a point of inflection at which the expenditure overshoots the income. At this point, the retiree starts eating into the principal component of the retirement corpus, but the corpus goes to zero only at the age of 90, which is the expected life expectancy.
However, the above planning can go horribly wrong, as it does not consider the sequence of return risk. To understand this, let us look at another example.
Understanding sequence of return risk
In the table below, we compare the terminal value of two portfolios that earn the same average return of 125, but in different sequences (the return earned by portfolio 2 is in the reverse sequence of the return earned by portfolio 1). This difference in sequence of returns is enough to lead to a large gap in the ending value of the two portfolios in only five years. For retirement planning, which involves a couple of decades, the difference in terminal value due to sequence of return can be overwhelming.
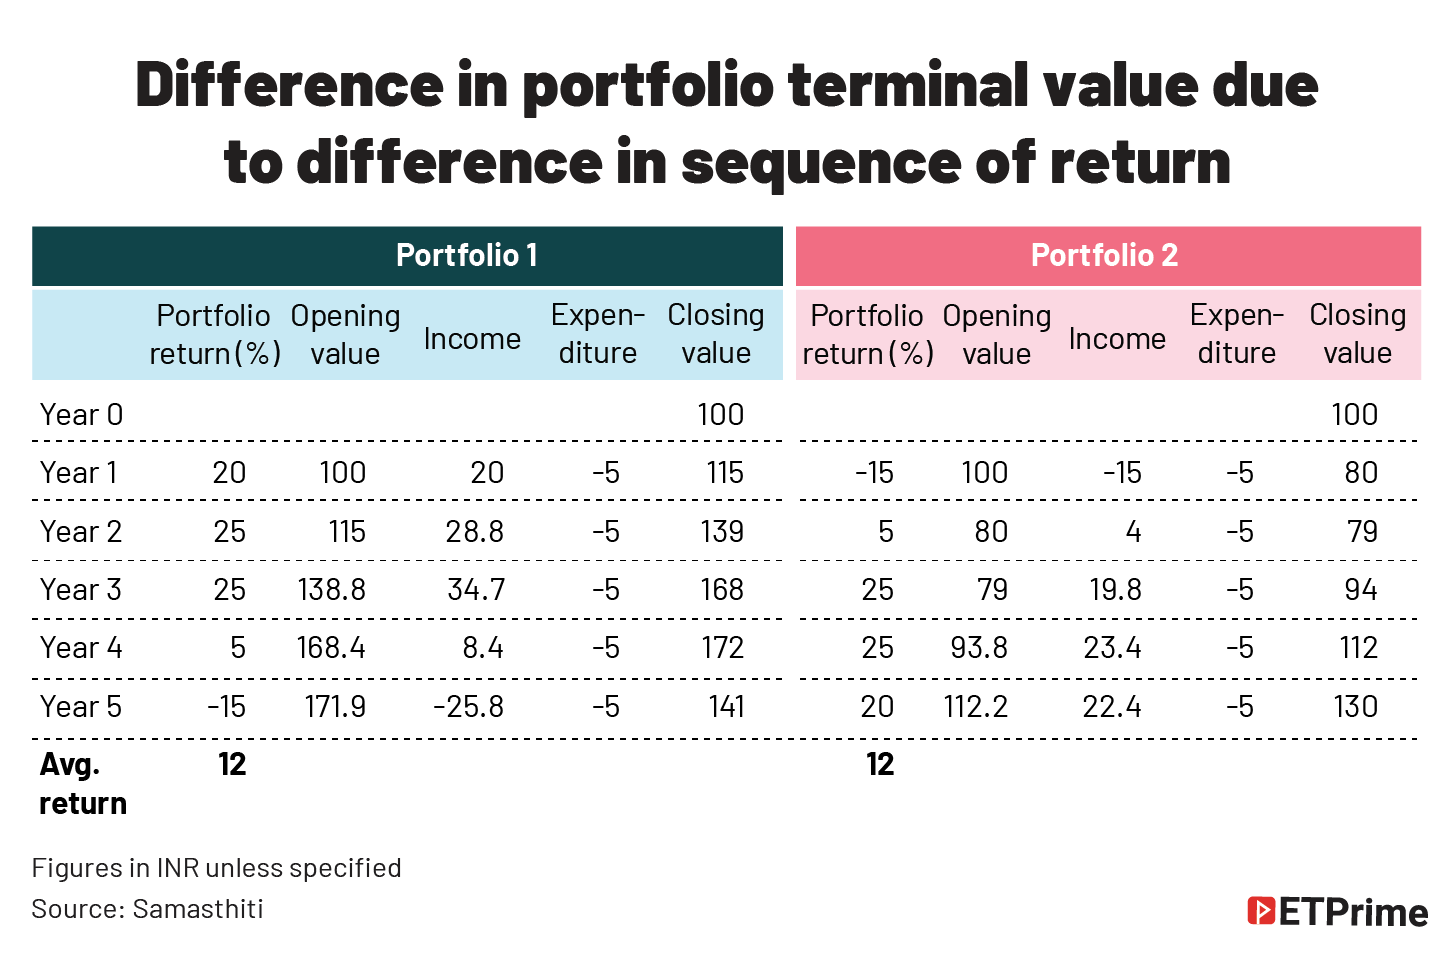
Returns in financial markets are not earned linearly. Rarely will the portfolio earn the same returns even in two consecutive years, let alone during the entire retirement period. This risk is called the sequence of return risk. We need to consider not only the average return earned by a portfolio, but also the sequence or the volatility in which those returns were earned.
Unfortunately, there is no way to incorporate this volatility in a PV-FV framework. Such frameworks rely on one single input for returns and inflation, and this same input is used for computation year after year. We should stop relying on such frameworks for drawing up retirement plans, as they ignore a critical element in the real world, volatility.
Safe withdrawal rate to the rescue
The concept of a safe withdrawal rate (SWR) provides a much better framework for designing retirement plans, as it incorporates the sequence of return risk. Let us first try to understand what SWR is and then discuss how it can be computed.
The SWR is the withdrawal rate from a retirement portfolio that does not lead to premature exhaustion. It is important to note that the SWR is the withdrawal rate in the first year of retirement. For the subsequent retirement years, withdrawal from a retirement portfolio is reached by applying a rate of inflation on the withdrawal amount of the first-year withdrawal amount. Alternatively, in real-returns, SWR is a maximum fixed withdrawal rate throughout the lifetime of the portfolio that ensures its success.
As an example, let us assume that an individual has accumulated a retirement corpus of INR1 crore at the age of 60. If the individual uses an SWR of 4%, she will withdraw a sum of INR4 lakh in her first year of retirement. In the subsequent year, assuming an inflation rate of 10%, she will withdraw INR4.4 lakh in her second year of retirement, and so on. Her chosen rate of 4% withdrawal in the first year of retirement, and then an inflation-adjusted withdrawal every subsequent year can be classified as “safe” is she does not exhaust her retirement corpus till her life expectancy.
The SWR is little tricky to calculate. It cannot be arrived at by using the PV-FV framework. It accounts for the investment returns of the portfolio as well as the annual withdrawals and inflation. Because we need to incorporate a volatile sequence of returns, we must make use of simulation to estimate this number, which is what our detailed study does.
We look at debt and equity return over the past 20 years and use these data to conduct multiple simulations to estimate a SWR which planners and investors can use in India.
The reason why simulation is helpful is because it allows us to use multiple sequences of equity and debt returns and see how a retirement portfolio behaves when faced with such varying returns. Not only are the equity and debt return simulated, but we also simulate different inflation rates. This allows for more realistic simulations that can potentially mimic the journey of a retirement portfolio over multiple years. We define SWR as the rate where 95% of the portfolios survive successfully.
SWRs that were obtained as part of our study have been reproduced below:
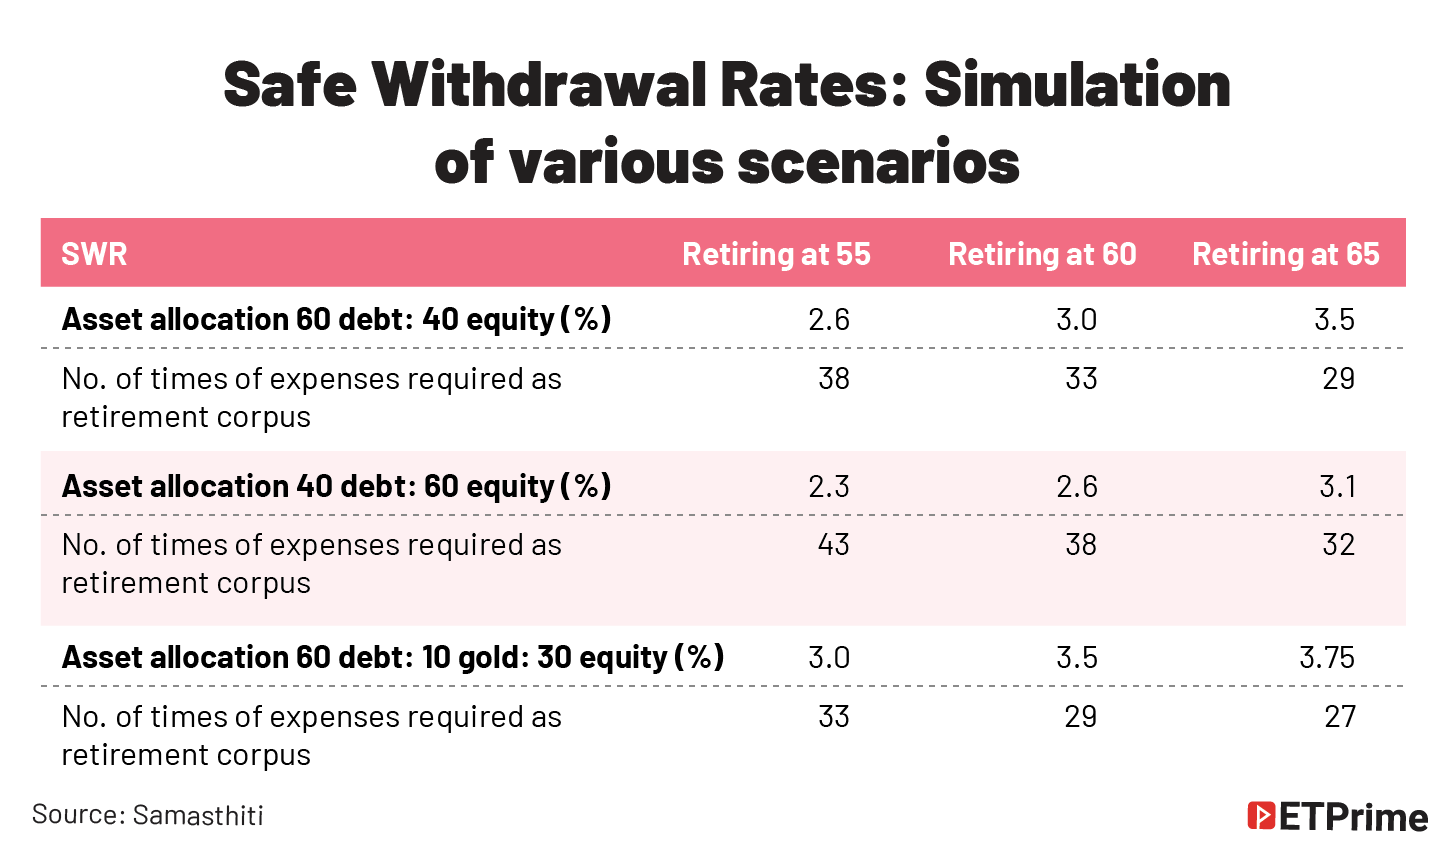
For a typical retiree who is looking to retire at age 60 and follows the conventional 60% debt and 40% equity portfolio, we are looking at a SWR of 3%. This number increases to 3.5% if we delay retirement by 5 years to age 65. Conversely, if we retire at age 55, the SWR falls to 2.6%.
Undoubtedly, the numbers look bleak. But it is what it is. Our simulations are not based on hypotheticals – we have used actual market return and inflation data and simulated them over a million times. These numbers are very accurate.
The only solace we can provide is that these are post-tax SWRs. We have baked in a debt taxation of 30% and equity taxation of 10%. For those who will face lower taxation, the study provides alternative SWRs for different tax rates.
Why are the SWRs so ‘low’?
The SWRs obtained in the study reflect the Indian market structure. If 60% of your retirement portfolio is in fixed income assets, where returns barely meet inflation on a pre-tax basis (and most certainly not on a post-tax basis), ‘low’ SWRs are pre-ordained.
Does this mean you can target a higher SWR by increasing the share of equity in your retirement portfolio? Unfortunately, we don’t have good news to share here. If you look at SWRs for an asset allocation of 40% debt and 60% equity portfolio, its lower than our base case! This is because the incremental returns from higher equity share is trounced by the increase in sequence of return risk.
It is important to understand that a higher share of equity is a terrific way to increase the expected return in a portfolio by harnessing the power of compounding. However, in a portfolio that is subject to frequent withdrawals, like a retirement portfolio, this process of compounding is sabotaged again and again. To expect that a higher share of equity will have the same impact in a portfolio with frequent withdrawals compared to a portfolio without withdrawals is a grave folly.
The silver lining in this discussion is that our simulations suggest that one way to benefit from a higher share of equity is to increase the retirement period – thereby giving the equity portfolio a longer time to recover from a sequence of adverse returns. If you look at the SWR for retiring at age 55, the higher share of equity does help in improving the SWR from 2.6% to 3.1%.
Targeting an early retirement is a luxury few can afford. For others, there is fortunately an easy way to increase their withdrawal rates.
The golden touch of gold
An encouraging finding from our study is that introducing a 10% allocation to gold can help to achieve better withdrawal rates. For a typical retiree who is retiring at age 60 and follows a 60% debt: 10% gold: 30% equity asset allocation, the SWR increases to 3.5%. The stability that gold provides in a retirement portfolio can markedly weaken the sequence of return risk.
How to use these findings to estimate required retirement corpus?
Withdrawal rates not only help us understand how much we can withdraw from a retirement corpus, but also help us calculate the retirement corpus required. Once we know what is the withdrawal rate that we want to lock in for our retirement corpus, we can calculate the required corpus using a simple calculation: divide 100 by the withdrawal rate and multiply this number with the expected annual expenses at retirement. For instance, for a 3% SWR, the required retirement corpus will be 100/3, which is approximately 33 times the retirement expenses.
Let us go back to our earlier example and check what the required requirement corpus should be based on SWR. We had an individual who is 40 years old and expects to retire at 60, with current monthly expenditure of INR1 lakh, which is expected to inflate at 6% each year. This monthly expenditure of INR1 lakh today will increase to INR3.21 lakh at 60, translating to an annual expense of INR38.5 lakh. The required corpus will be 33 times of INR38.5 lakh, which is INR12.7 crore.
In our earlier example, based on the PV-FV formula, we had calculated the required retirement corpus to be INR5.4 crore, which is a significant understatement!
Limitations of using SWRs in India
While we believe SWR is a superior methodology for use in retirement planning, it is not without limitations. SWRs are arrived at using historical data of asset returns and inflation. A developed market, like the US, which presents more than 100 years of historical data, provides a fertile ground for calculating SWR.
The historical data in India for equity and debt returns is short. Moreover, the short-time series data is not stationary, i.e., the data exhibits changing structure and volatility. As we keep adding more data to our analysis on an annual basis, our SWR computations will improve in robustness.
The final word
A retirement plan spans decades, starting with an accumulating phase and ending with a distribution phase. This long journey that a retirement plan traverse is akin to a crowded, narrow, and circuitous road rather than a smooth highway. It is critical that our retirement plans take note of this. Using the SWR methodology provides a good tool to navigate the twists and turns and we hope our analysis aids both investors and planners in better retirement planning.
(This article was published in ETPrime on May 22, 2024 and can be accessed from the link https://economictimes.indiatimes.com/prime/money-and-markets/how-much-is-enough-to-retire-safely-here-a-simple-calculation-may-not-work-/primearticleshow/110303440.cms)


0 Comments