Higher returns with significantly lower drawdowns
Momentum is a popular investing strategy in which a portfolio is constructed by buying the winners and pruning the laggards. As is often repeated, momentum wears the crown of being described as the “premier anomaly” by Eugene Fama, the creator of the Efficient Market Hypothesis.
Two types of Momentum
There are two types of momentum strategies – absolute momentum and relative momentum. In absolute momentum, the historical price data of a single investment is analyzed to check if it’s exhibiting positive momentum. If yes, the investment is bought, otherwise, not. In relative momentum, two (or more) investments are compared to check their momentum, and the investment with the highest momentum is bought.
The most popular momentum strategies are relative strategies. For example, you may invest in the 10 stocks which are displaying the highest momentum from the universe of Nifty 50 stocks. This is an example of a relative momentum strategy as from 50 different investment opportunities (the 50 stocks that form part of the Nifty 50), you are selecting the top momemtum stocks. A stock’s current momentum is not being compared with its own past momentum, but the momentum of other stocks. Hence the word “relative”.
In absolute momentum, you would have taken a single stock X and looked at its price history to determine whether it’s exhibiting momentum currently. One way of doing this would be to compare whether stock X’s past 12 month return beats the risk free rate. If yes, the stock is exhibiting momentum and is bought.
Dual Momentum combines Absolute and Relative Momentum
Dual Momentum is a momentum strategy introduced by Gary Antonnaci which combines absolute and relative momentum. Here is the strategy as described by Gary in his book,
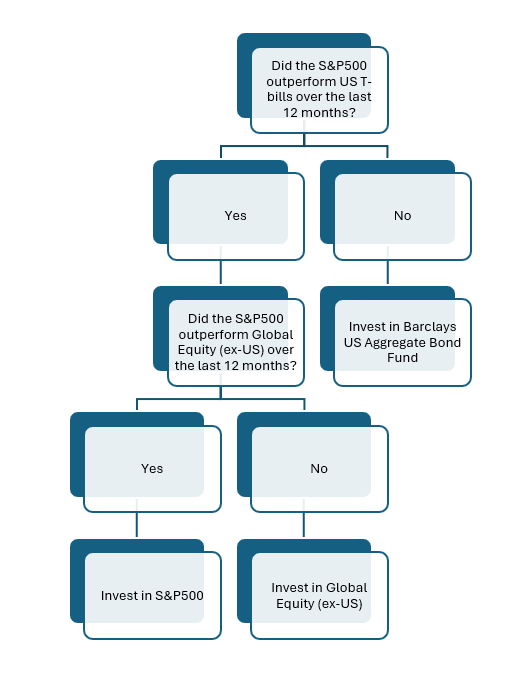
This strategy has two premises. First, apply absolute momentum on S&P500 and check if equity is displaying good positive momentum (this is done by comparing the S&P500 return with the return of a safe debt investment like Barclays US Aggregate Bond Fund). If equity, as proxied by S&P500, is not displaying momentum, invest in Barclays US Aggregate Bond Fund.
If, however, S&P500 is displaying positive momentum, check for relative momentum between S&P500 and Global Equity (ex-US) and invest in whichever has higher relative momentum. In this strategy, MSCI ACWI ex-US Index was used to proxy Global Equity (ex-US).
The portfolio is rebalanced every month. Thus, every month, the strategy is either wholly invested in S&P500, or Barclays US Aggregate Bond Fund or MSCI ACWI ex-US Index.
Dual Momentum – Indian Edition
For applying this strategy to India, we have replaced the original constituents as follows,
- S&P500 has been replaced with Nifty 50. This was a straightforward choice0 as we are replacing the benchmark US equity index with the benchmark Indian equity index.
- To check for absolute momentum, Barclays US Aggregate Bond Fund has been replaced with Aditya Birla Sun Life (ABSL) Income Fund. Given that we intend to backtest this strategy since Nifty50’s inception (i.e. from November 1995), we need a debt mutual which has an equally long vintage. ABSL Income Fund presents a good option here as it has an inception date of October 1995 and is one of the oldest debt mutual funds in India.
- To check for relative momentum, we need an alternative investment option to Nifty 50. Ideally, this alternative should have a low correlation with Nifty 50. We think Gold is a good option here and we have accordingly replaced Global Equity (ex-US) with Nippon India ETF Gold BeES. From 30 November 2009 onwards, our backtest uses the last trading price (LTP) of Gold BeES on National Stock Exchange. For the period earlier to 30 November 2009, we have used the actual price of Gold in INR.
Below is the graphical representation of the Indian edition of Dual Momentum,
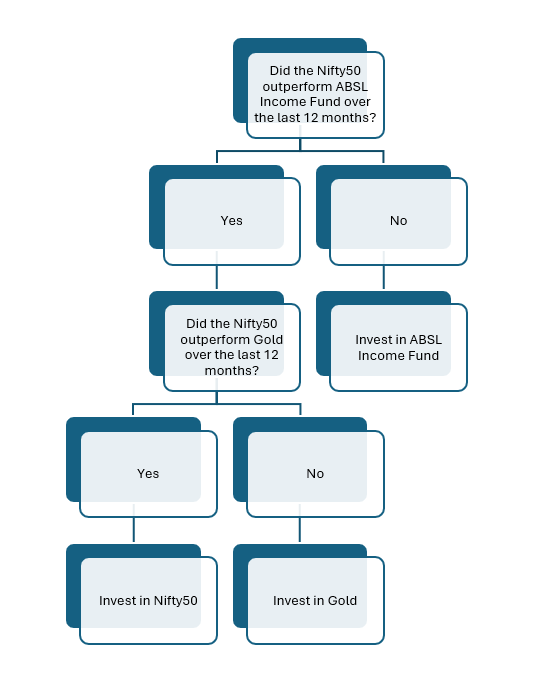
As in the original strategy, the portfolio is rebalanced every month. Thus, every month the portfolio is either wholly invested Nifty50, or ABSL Income Fund or Gold.
The selection of a backtest period is important as it can materially affect the results. To remain objective, we have backtested this strategy right from Nifty50’s inception. Nifty 50 has an inception date of November 3, 1995 with a base of 1000.
Since the 12 month of lookback period is conventionally selected by excluding the current month, the inception date for the backtest is December 1996. The backtest has been run till January 2024, with month-end values being considered.
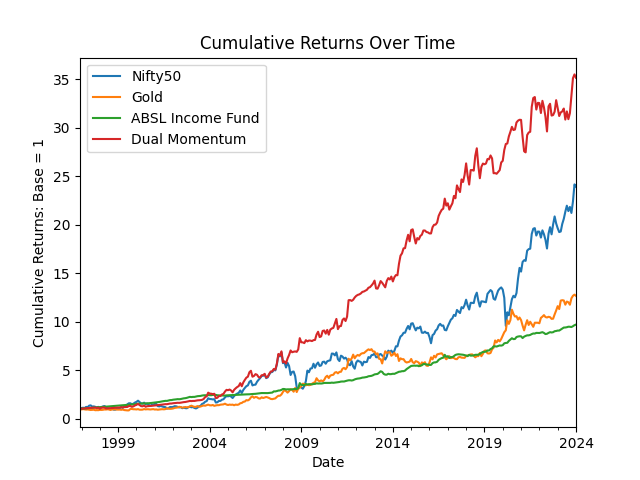
Over this backtest period, Nifty50 delivered a CAGR of 12.4%, while Dual Momentum delivered a CAGR of 14.0%. There is an outperformance by more than 1% each year which over the period of the backtest accumulates to a substantial difference in terminal value.
What is more noteworthy is the substantial drop in drawdowns in the Dual Momentum strategy. This can visually be observed in the graph above – most prominently in the year 2008 and 2020.
Even though we have objectively selected the strategy start date, there could still be starting point bias. To check for this, we backtested this strategy for each subsequent year (starting from 1996 onwards, while ensuring that the backtest period is at least 15 years). The data has been presented below,

A few observations on the above data,
- Dual Momentum beats Nifty50 buy-and-hold in each of the above backtest except one.
- The key edge of the strategy is in lowering the drawdowns significantly.
- For instance, in November 2008, Nifty50 witnessed drawdowns of more than 50%, whereas the drawdown in Dual Momentum was significantly lower at about 21%. This is again observed in 2020 when Nifty50 had a drawdown of close to 30%, but the strategy recorded drawdown of about 11%.



0 Comments