

This post is based on our research study titled "Boosting Retirement Income through Dynamic Withdrawals" by Ravi Saraogi, CFA which can be accessed here.
Retirement income needs to cover everyday expenses, even when markets have a difficult year. But if the portfolio falls in value, should the retiree continue withdrawing the same amount, or reduce spending to give the money more room to recover?
The familiar inflation-adjusted withdrawal approach (static withdrawal approach) keeps spending predictable. You begin with a chosen withdrawal amount and increase it with inflation each year. Your purchasing power stays the same for as long as the portfolio can fund those withdrawals.
In contrast, Bengen’s hard floor and ceiling is a dynamic withdrawal strategy that allows income to move with the portfolio, while placing limits on how much the withdrawal can rise or fall in a year.
What Is the Bengen Hard Floor and Ceiling Strategy?
The idea is straightforward. First, calculate the withdrawal as a fixed percentage of the current portfolio. Then compare the withdrawal amount with what you withdrew last year. If the change is too large, a floor or ceiling limits the adjustment.
In our study, the fixed percentage used is 3.2%. The floor limits a reduction to 15% of the previous year’s withdrawal, while the ceiling limits an increase to 20%. This means that this year’s withdrawal cannot fall by more than 15% of previous year’s withdrawal and cannot exceed more than 20% of previous year’s withdrawal.
This gives the retiree some room to adjust. After a sharp portfolio fall, income can decline without taking the full cut suggested by the fixed-percentage rule. After strong growth, income can rise, but the ceiling holds back part of the increase.
The limits apply to the actual rupee amount withdrawn. They are measured from the previous year’s withdrawal, so the permitted range changes each year.
A Realistic Example
Imagine retiring with ₹1 crore and beginning with a withdrawal rate of 3.2%. This means the annual withdrawal will be ₹3.2 lakhs a year, or a monthly withdrawal of about ₹26,667.
Suppose, in a hypothetical weak year, the portfolio is worth ₹75 lakhs when the next withdrawal is calculated. Taking 3.2% would give you ₹20,000 a month—a reduction of about one-quarter from your starting income.
The floor cushions that fall. Because the reduction is limited to 15%, you would withdraw about ₹22,667 a month instead. Your budget still has to adjust, but the immediate reduction is smaller.
Now consider a stronger year as an alternative outcome. If the portfolio were worth ₹1,25,00,000, taking 3.2% would give you about ₹33,333 a month. The ceiling would limit this to ₹32,000, an increase of 20% over the starting withdrawal.
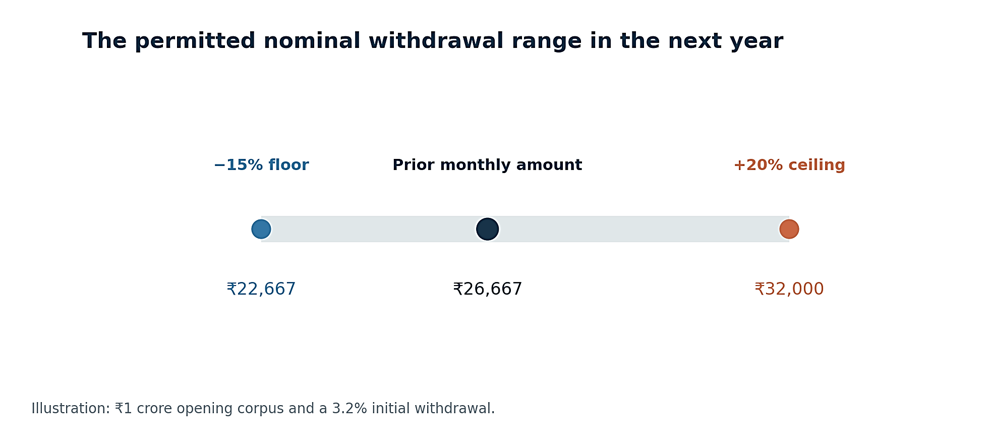
Figure 1. How the next year’s withdrawal is bounded.
Source: Saraogi, R. (2025). Boosting Retirement Income through Dynamic Withdrawals. The band is based on the previous nominal withdrawal. The ₹75,00,000 and ₹1,25,00,000 examples above are hypothetical applications of that rule, not simulated findings.
There is a cost to cushioning the income reduction. In the example where the portfolio value fell, you withdraw more than the fixed-percentage calculation suggests, leaving less money in the portfolio. To understand whether that is a useful trade-off, we need to look at both the income delivered and the corpus left behind when using this strategy.
How We Evaluate the Strategy
Knowing whether the money lasts is useful, but it does not tell us the whole retirement experience. A strategy might preserve the portfolio by cutting income to a level the retiree finds difficult to live on. Our research therefore asks four questions:
Spending — how much can you withdraw over time?
Stability — how much does that income change?
Savings — how much money remains in the portfolio?
Sustainability — can the money and an acceptable level of spending last?
We compare the strategies across 10,000 simulations using Indian market and inflation data, a 30-year retirement and a 50:50 equity–debt portfolio. Each simulation begins with a 3.2% withdrawal. The spending and savings charts use poor, average and good market outcomes, while stability uses worst-case, average-case and best-case outcomes, to show the spread of results. These correspond to the 10th percentile, median and 90th percentile for each measure.
Spending — What Happens to Your Purchasing Power?
Under the static approach, which is labeled as “Static baseline”, withdrawals rise with inflation, preserving the same purchasing power until the portfolio can no longer pay them. Bengen Hard allows that purchasing power to change as spending responds to the portfolio.
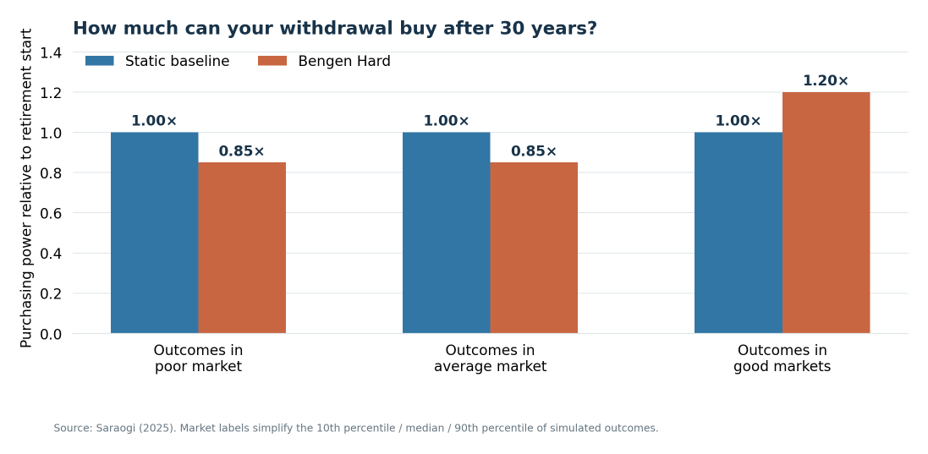
Figure 2. How much purchasing power remains in year 30?
Source: Saraogi, R. (2025). Boosting Retirement Income through Dynamic Withdrawals. A value of 1.00× means the same purchasing power at the end of retirement as at the beginning of retirement. Poor, average and good market outcomes represent the 10th percentile, median and 90th percentile, calculated separately for each strategy.
After 30 years, for market outcomes that are poor or average, the retiree is left with 85% of the purchasing power they started with. In other words, income that originally bought ₹100 worth of goods and services would buy ₹85 worth. In good market outcomes, spending reaches 120% of the starting level—so purchasing power has increased.
This is the flexibility the rule provides. You may be able to spend more when the portfolio does well, but you must also be willing to spend less when it cannot support the original amount. The annual floor cushions a cut in rupee income; it does not preserve the same purchasing power throughout retirement.
Stability — How Much Does Income Change?
In the Bengen hard approach, there is a limit on annual changes that the retiree needs to plan around. Even so, the retiree still needs to adjust spending. A smaller withdrawal may require a smaller budget, while inflation can make the same rupee amount buy less.
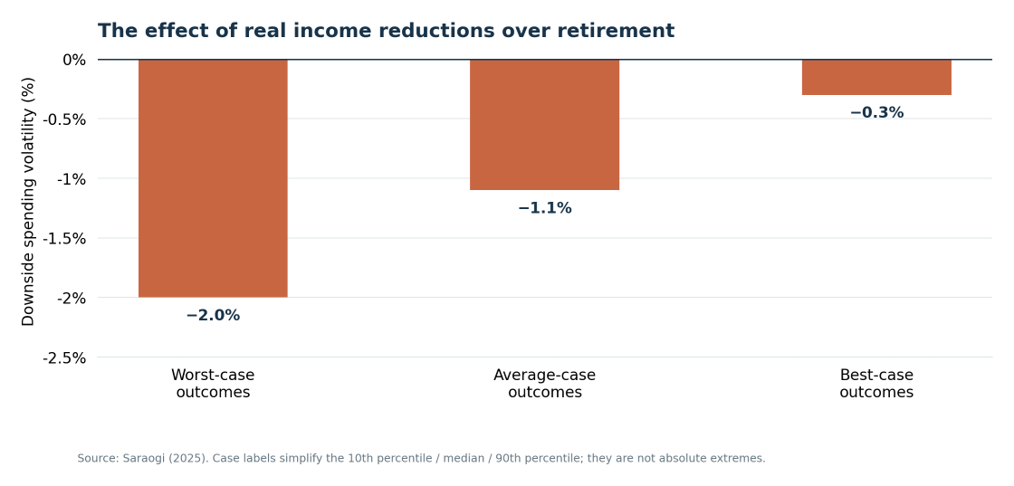
Figure 3. How strongly do income reductions affect spending?
Source: Saraogi, R. (2025). Boosting Retirement Income through Dynamic Withdrawals. The chart shows the magnitudes of downside spending volatility. Worst-case, average-case and best-case outcome reductions correspond to the 10th percentile, median and 90th percentile. This measure adds up real withdrawal reductions and expresses their effect as an annualized percentage over the full retirement period. It is not the size or limit of a single year’s cut.
The median result for downside spending volatility is −1.1%. This is the study’s measure of the overall effect of income cuts, rather than a prediction that spending will fall by that amount every year. The practical point is that the floor moderates adjustments, but the retiree still needs room in the budget to absorb them.
Savings — How Much of Your Corpus Remains?
When the retiree withdraws less, more money stays invested. When withdrawals rise, more of the portfolio is used during retirement. Bengen Hard therefore changes both the income received along the way and the amount left at the end.
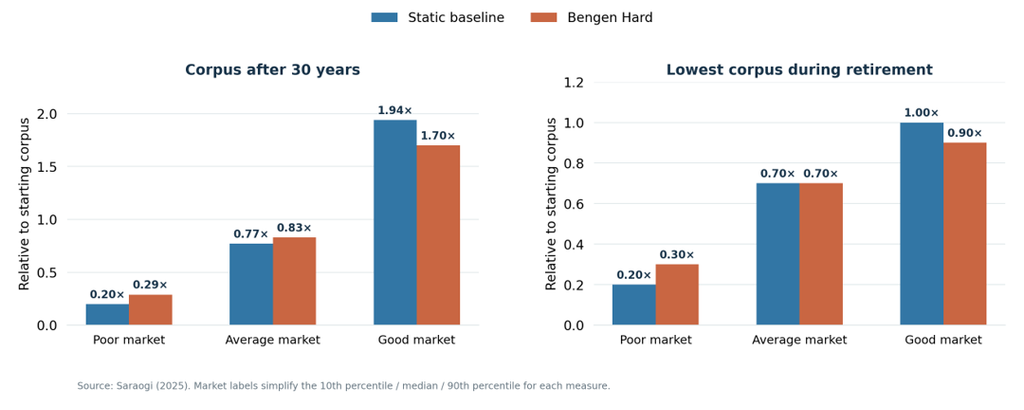
Figure 4. What remains at the end, and how low does the corpus fall?
Source: Saraogi, R. (2025). Boosting Retirement Income through Dynamic Withdrawals. Terminal corpus is the balance after 30 years; minimum corpus is the lowest balance reached during retirement. Values are relative to the starting corpus. Lower, middle and higher outcomes represent the 10th percentile, median and 90th percentile for each measure separately.
In poor market outcomes, Bengen Hard leaves 29% of the starting corpus at the end, compared with 20% under the static baseline. In average market outcomes, it leaves 83%, compared with 77%. Both portfolios have shrunk, but Bengen Hard retains more of the original money. This is because while the Static baseline never cuts withdrawals, under the Bengen Hard approach withdrawals can be cut, but subject to the floor.
In good market outcomes, the comparison reverses. Bengen Hard finishes with 1.70 times the starting corpus, while the static baseline leaves 1.94 times. Both have grown. The smaller balance under Bengen Hard accompanies the opportunity for higher spending in good market outcomes. Whether that is desirable depends on how the retiree weighs spending during retirement against leaving money behind.
The minimum corpus measure shows how low the portfolio falls along the way. In poor markets, Bengen Hard falls to 30% of the starting corpus, compared with 20% for the static baseline. Even when the portfolio survives, that decline can leave the retiree with much less financial room. In the average market outcomes, both reach a low of 70%.
Sustainability — Can the Money and Income Last?
The conventional failure rate asks a simple question: in how many simulations did the portfolio run out before retirement ended? At the common 3.2% starting withdrawal, the rate is 1.3% for Bengen Hard, compared with 4.9% for the static baseline.
But running out of money is not the only way a retirement plan can fall short. Income might become too low to support the retiree even though some money remains. Our modified failure rate includes that possibility: it counts withdrawals below two-thirds of the planned amount for more than one-third of the retirement period as a failure too.
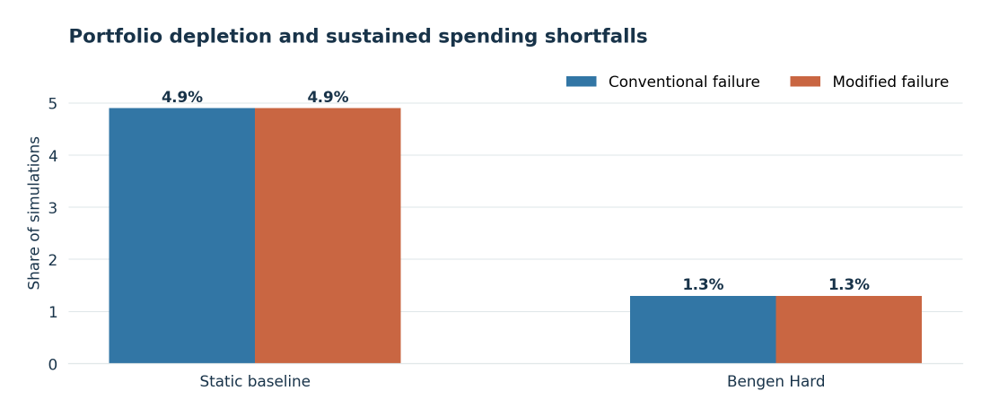
Figure 5. Portfolio failure and prolonged spending shortfalls.
Source: Saraogi, R. (2025). Boosting Retirement Income through Dynamic Withdrawals. Results use the common 3.2% initial withdrawal. Modified failure includes depletion or a sustained breach of the study’s spending floor.
For Bengen Hard, the modified failure rate is also 1.3%. Adding the prolonged income-shortfall test does not increase the reported rate in these simulations. That does not mean every retiree receives the income they hoped for: as the spending results show, purchasing power can still fall without crossing this more severe shortfall threshold.
Can You Start With a Higher Income?
Our research also asks whether the ability to adjust spending allows retirees to begin with a higher starting withdrawal rate. Around a 50:50 equity–debt allocation, our simulations show a modest improvement for Bengen Hard over the static baseline. While the Static baseline uses a starting withdrawal rate of 3.2%, the Bengen Hard approach can start with a higher starting withdrawal rate of around 3.6%.
That extra starting income has to be considered alongside what may happen later. The retiree still needs to accept the spending adjustments that make the higher initial withdrawal possible.
Who Might Find This Strategy Useful?
This approach may suit someone who wants income to respond to the portfolio but prefers limits on each year’s change. It requires some flexibility in the household budget. The question is whether a lower withdrawal can be accommodated without disrupting essential expenses.
It may be harder to use when the retirement portfolio must meet expenses that cannot easily be reduced. The floor cushions an immediate cut, but it does not guarantee the original purchasing power. The retiree therefore needs to consider both the size of a possible adjustment and what it would mean for day-to-day spending.
Conclusion
Bengen’s hard floor and ceiling lets retirement income change with the portfolio while limiting each annual adjustment. In the study, it leaves more balance money in poor market outcomes (by making cuts in withdrawals, subject to a floor) and reduces the simulated failure rate compared with the static baseline. In good market outcomes, it can allow more spending rather than accumulating a large inheritance.
The retiree gains a more responsive spending rule, but still has to manage changing income. Its usefulness depends on whether those changes fit the household budget and the amount the retiree wants to preserve for later needs or a legacy.
We will explore other dynamic withdrawal approaches in subsequent articles. Subscribe to the blog for future updates.
This article is based on research using Indian market data and is for informational purposes only. It does not constitute investment advice. Please consult your financial advisor before making investment decisions.
AI disclosure: This post was prepared with the assistance of large language models (LLMs), used for drafting, restructuring, and editing. The underlying analysis, data, and conclusions are the author’s own. The author has reviewed the content and is responsible for it, including any errors.


0 Comments