
Benchmarks Held Up, Broader Markets Lagged, and Yields Moved in Opposite Directions
October split the market along three lines: large companies against smaller ones, Indian bond yields against US yields, and technology-linked shares in the US and Asia against European stocks.
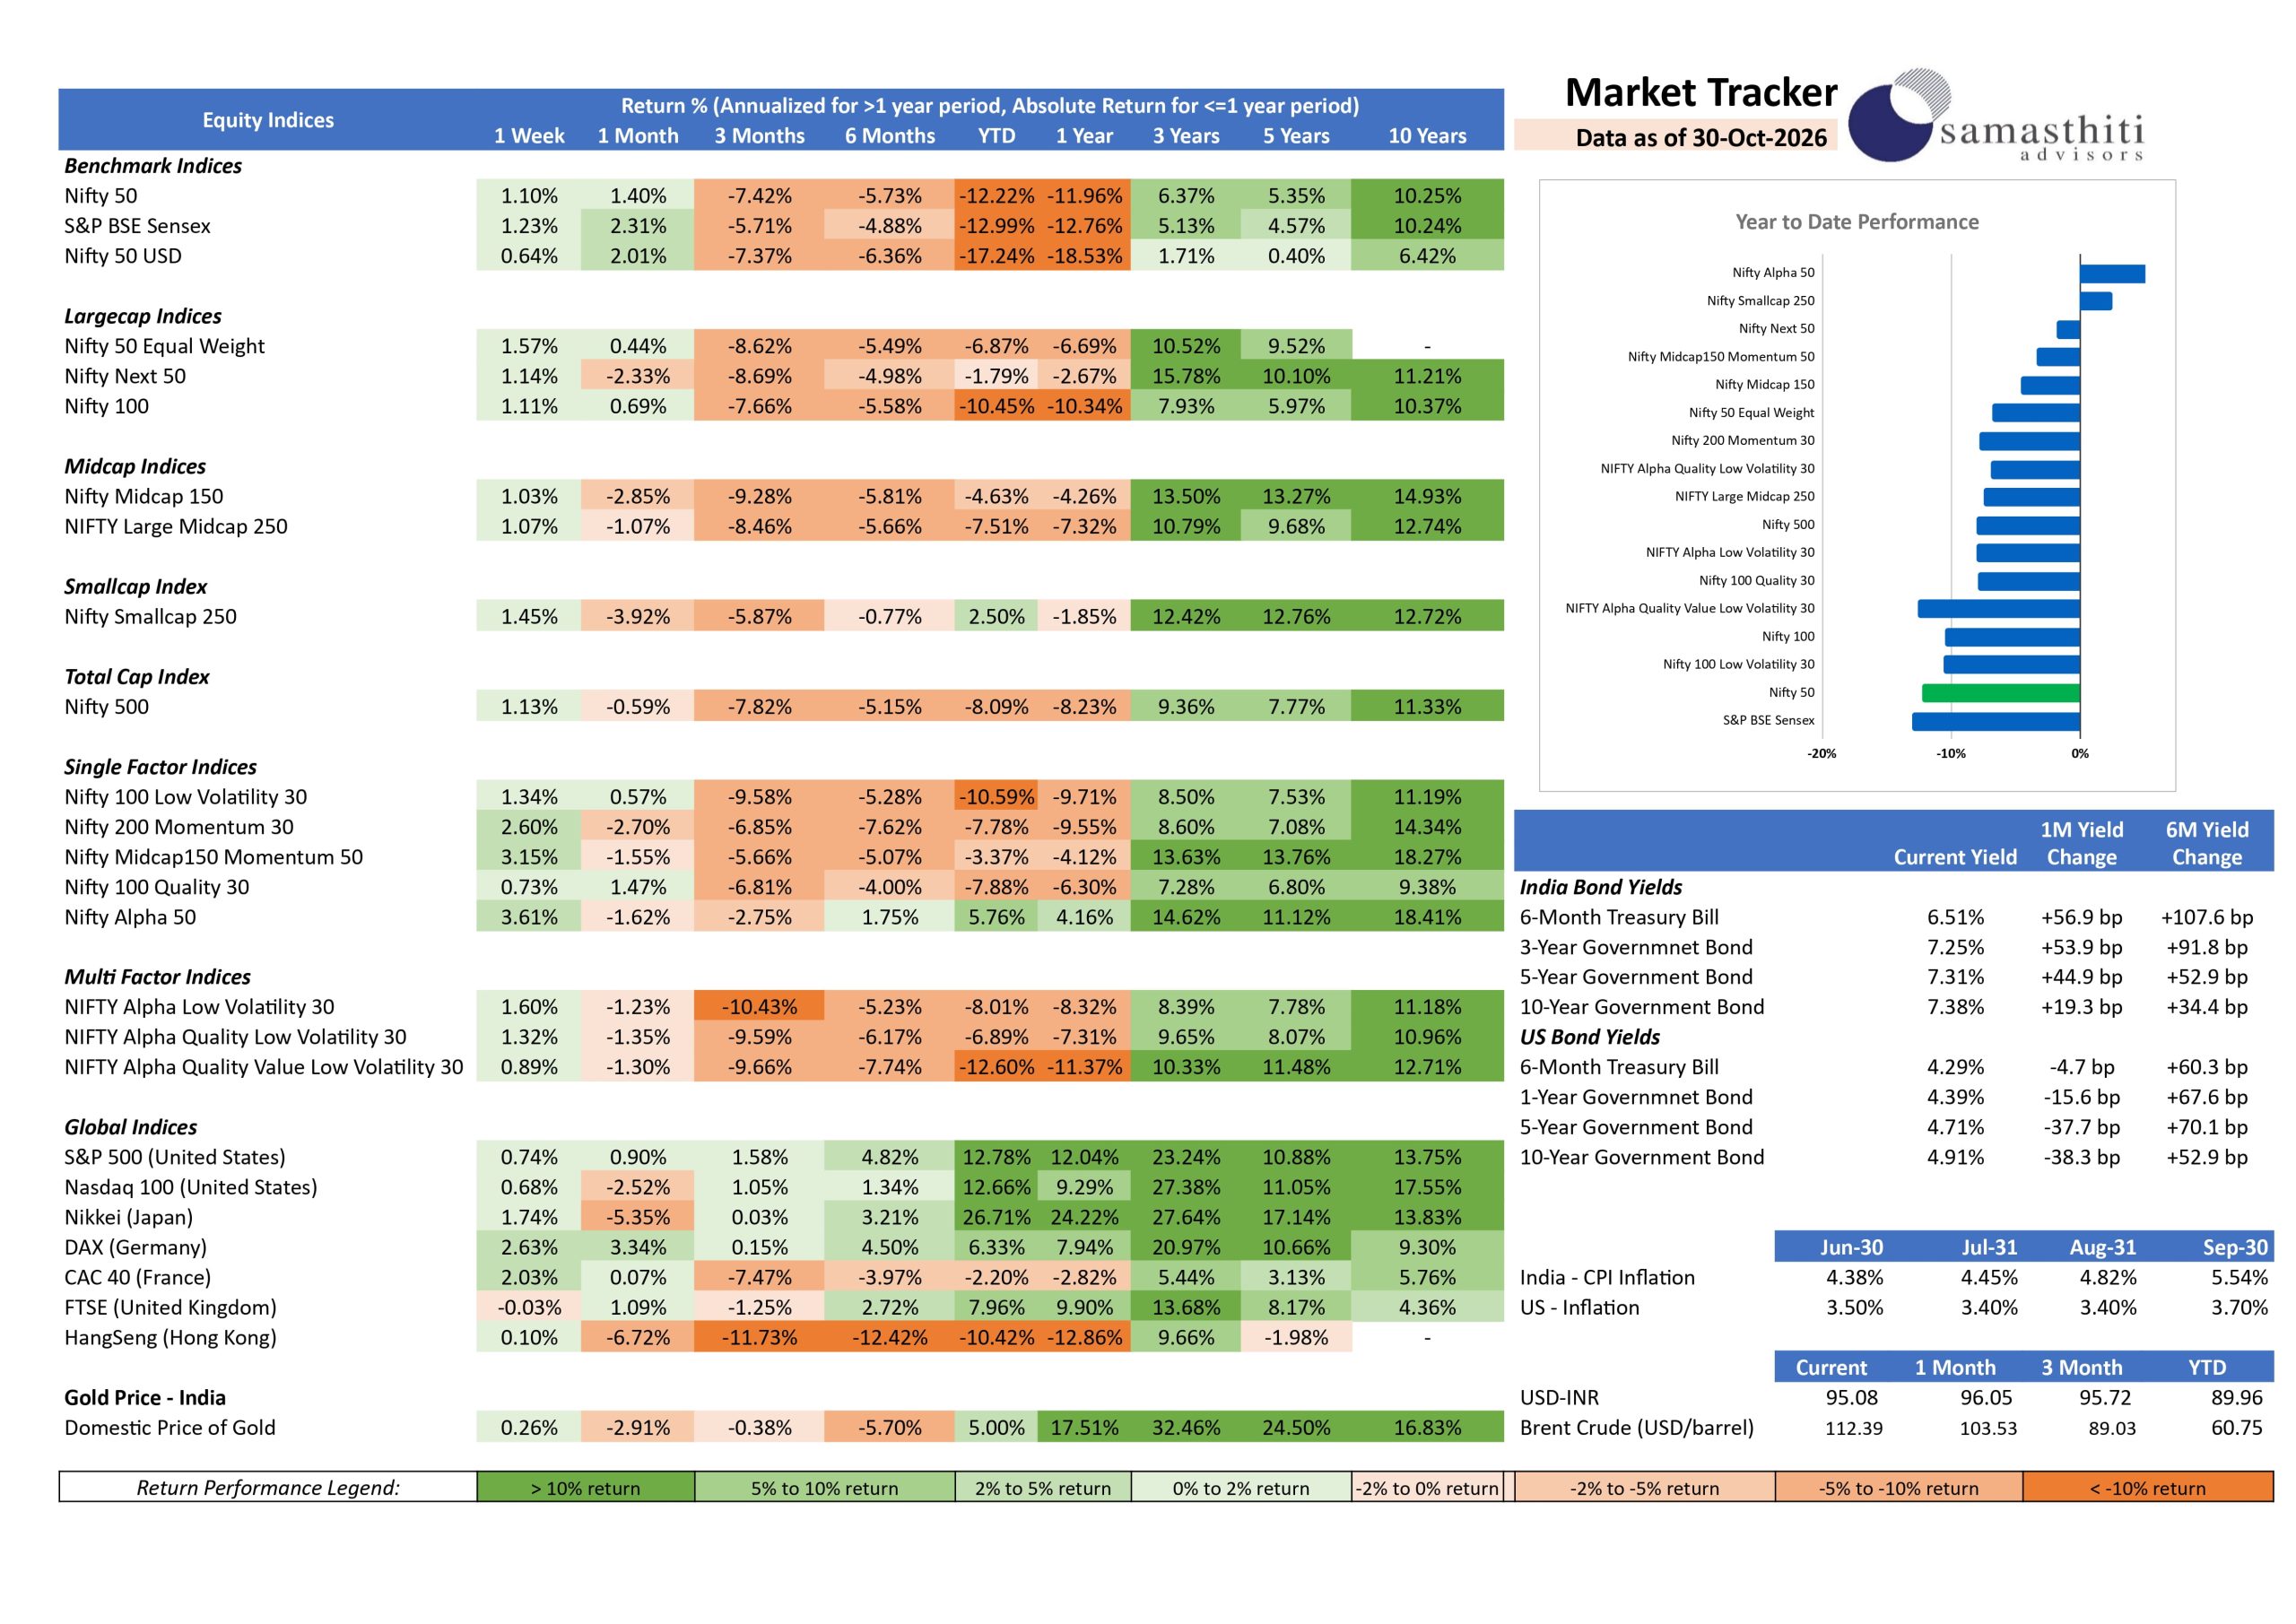
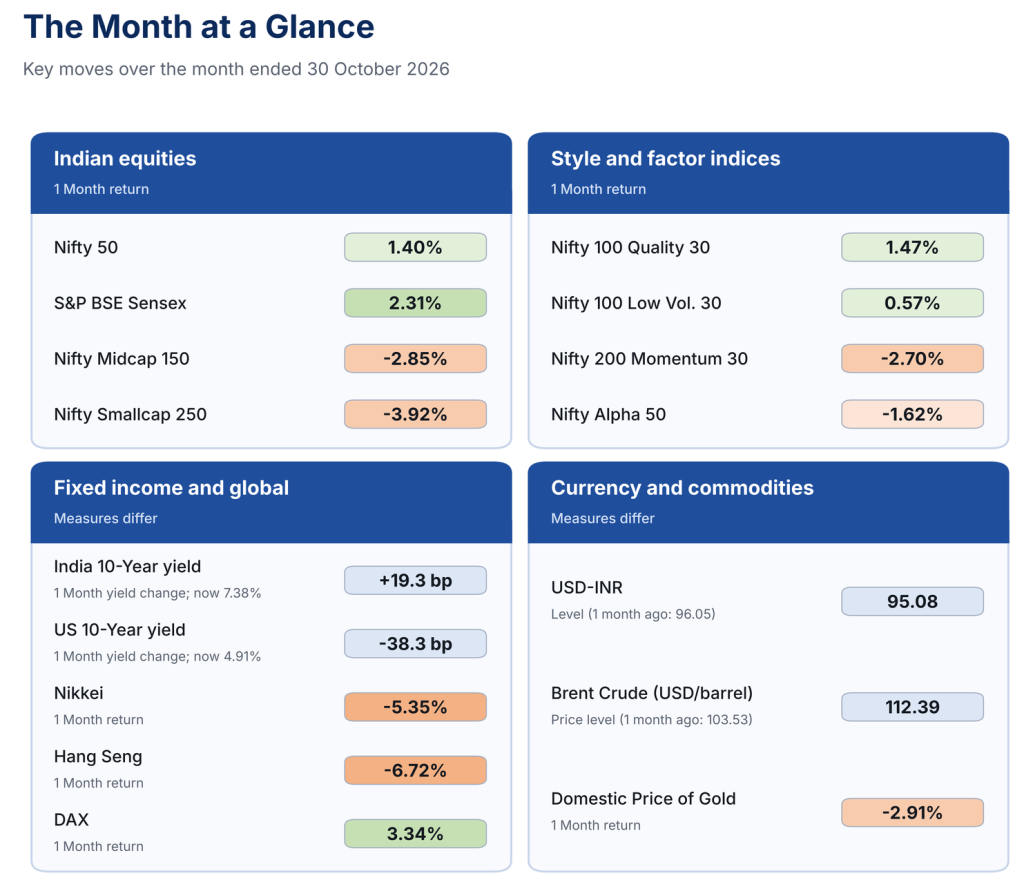
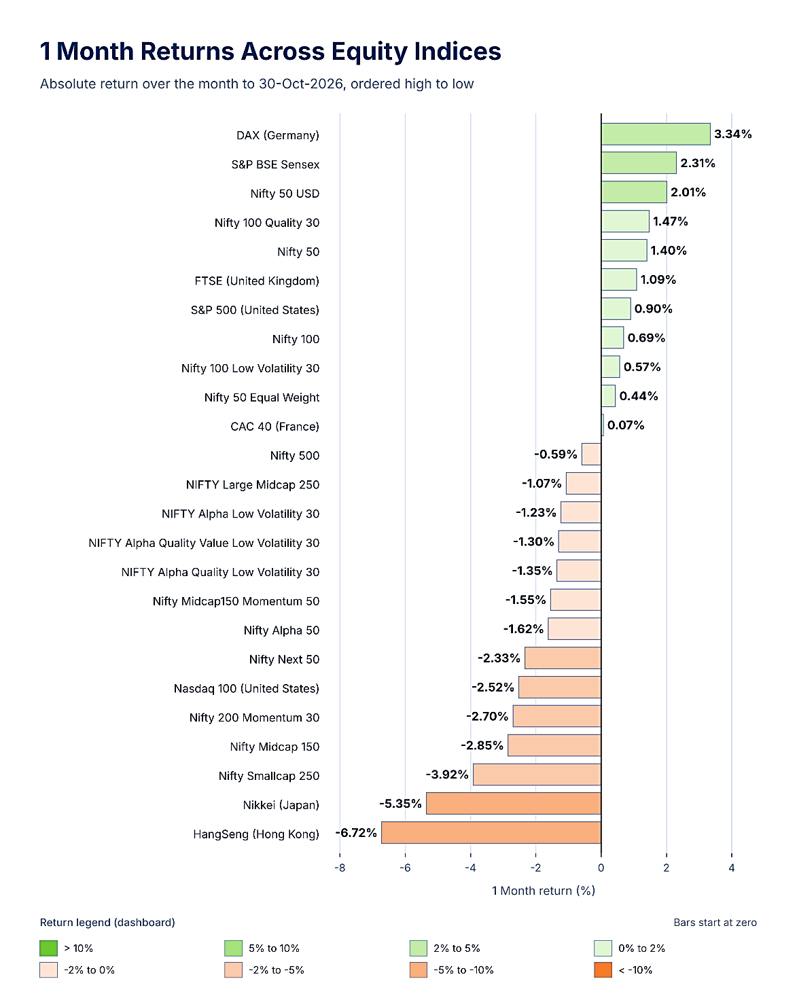
The Nifty 50 rose 1.40% and the S&P BSE Sensex rose 2.31%, led by a rebound in IT shares. Further down the market-cap range, the Nifty Midcap 150 fell 2.85% and the Nifty Smallcap 250 fell 3.92%.
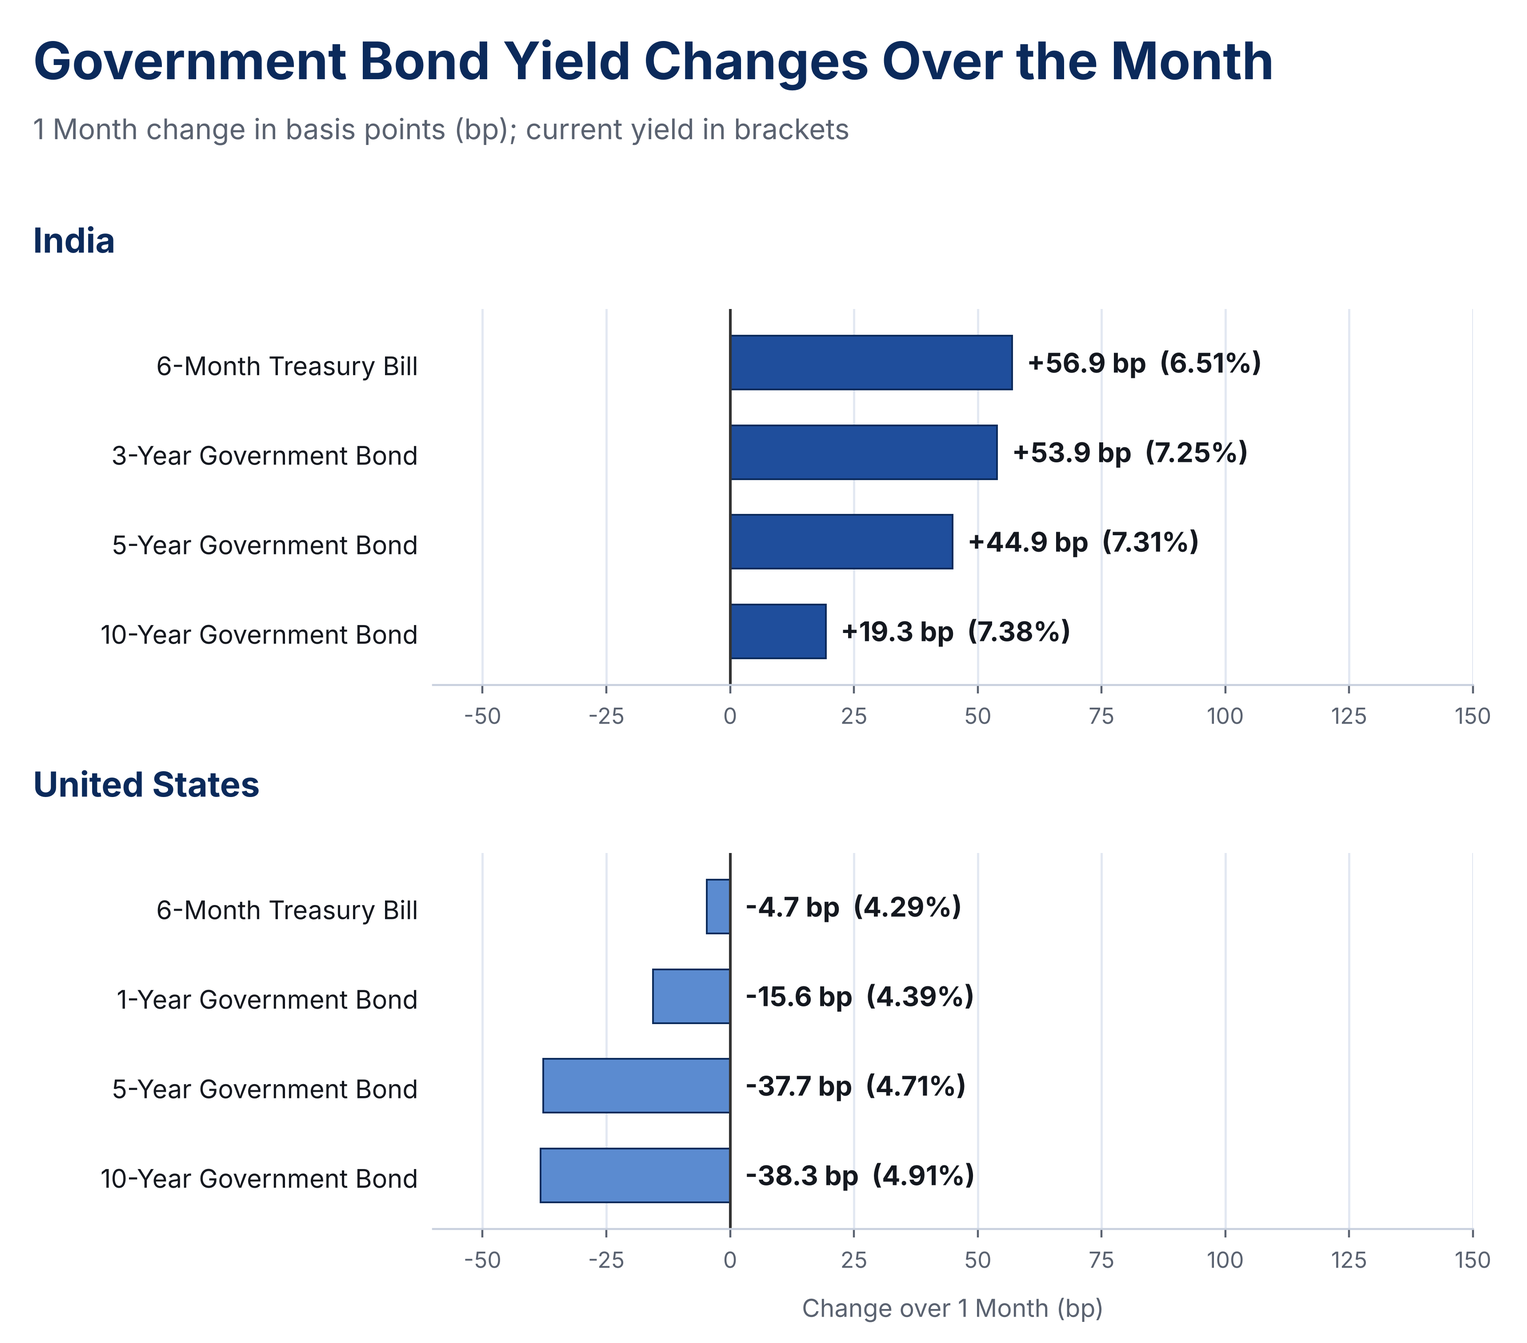
Bond markets moved apart. Indian government bond yields rose by between 19.3 and 56.9 basis points (bp; one bp is one-hundredth of a percentage point), while US yields fell by between 4.7 and 38.3 bp.
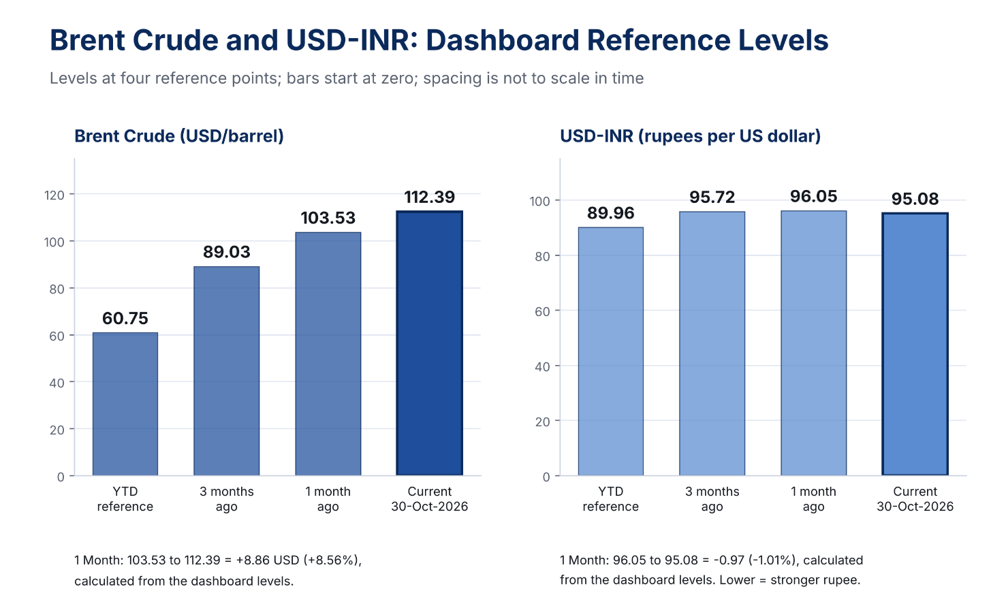
Overseas, the Hang Seng (-6.72%) and the Nikkei (-5.35%) were the weakest indices on our dashboard, and Germany's DAX (+3.34%) was the strongest. Brent crude ended at 112.39 USD/barrel, up from 103.53. The rupee strengthened to 95.08 per dollar from 96.05, and domestic gold returned -2.91%.
In short, the headline Indian indices looked steady, but the breadth underneath them was weak.
1. 📊 Indian Equities: Large Companies Gained While Mid and Smallcaps Declined
Large-cap benchmarks gained, while the Nifty Next 50, the midcap indices, the smallcap index and the broad Nifty 500 all ended lower.
The Nifty 50 rose 1.40% and the S&P BSE Sensex rose 2.31%. IT shares led the advance, with their strongest month in more than six years. September-quarter earnings largely beat expectations, and talk of a cut in long-term capital gains tax lifted sentiment further.
Higher crude oil prices, driven by Middle East tensions, kept the rally in check.
Underneath the benchmarks, participation was narrow. By the end of the month, most constituents of both the Nifty 50 and the Sensex were still lower over the month, and metal stocks fell as investors booked profits after a long rally.
The Nifty Midcap 150 fell 2.85% and the Nifty Smallcap 250 fell 3.92%.
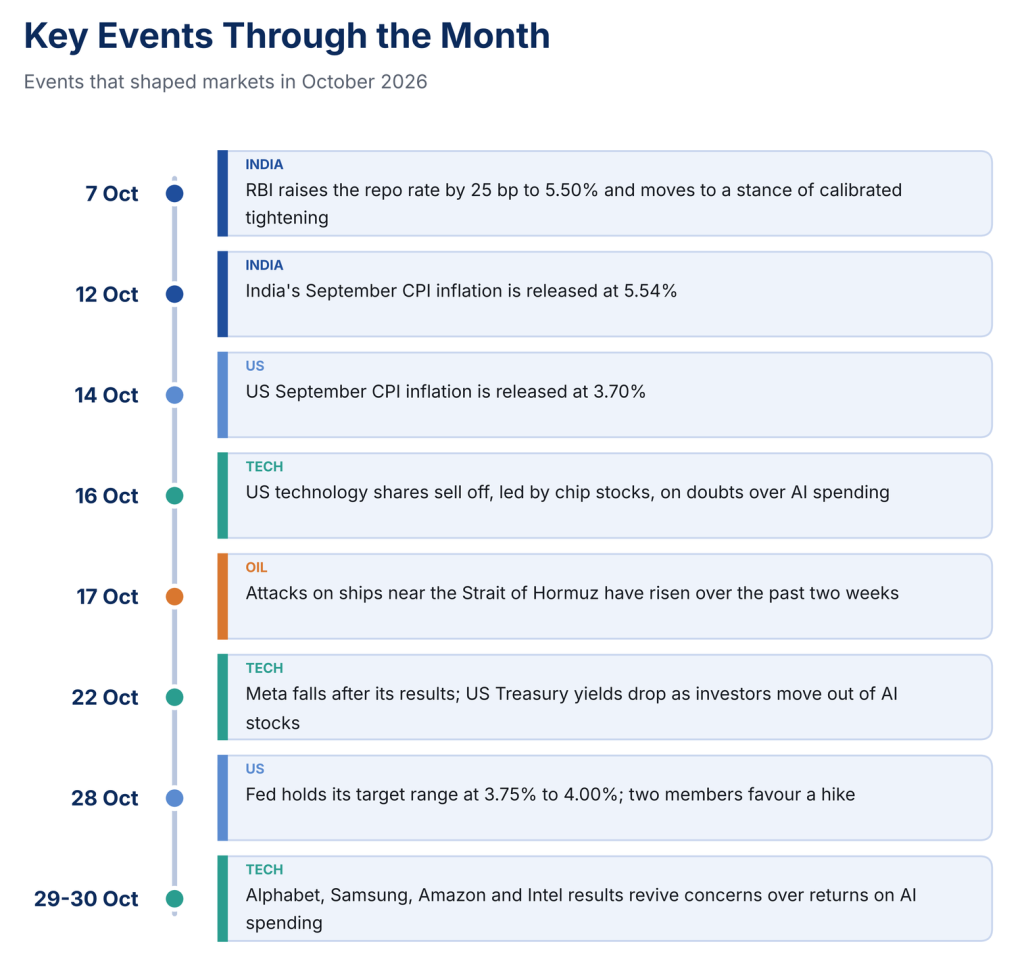
Policy and inflation news shaped the mood early in the month. The RBI raised the repo rate by 25 bp to 5.50% and moved to a stance of calibrated tightening. Soon after, September CPI inflation came in at 5.54%, above the RBI's 4% target, with food prices the main contributor.
Foreign portfolio investors were net sellers of Indian equities through the month, with crude oil prices staying high.
A handful of large IT and banking shares carried the benchmarks, while most other stocks, and mid and smallcaps in particular, declined.
Background, longer periods: the Nifty 50 is down 7.42% over three months and down 12.22% year to date. The Nifty Smallcap 250 is up 2.50% year to date.
Policy and inflation news shaped the mood early in the month. The RBI raised the repo rate by 25 bp to 5.50% and moved to a stance of calibrated tightening. Soon after, September CPI inflation came in at 5.54%, above the RBI's 4% target, with food prices the main contributor.
Foreign portfolio investors were net sellers of Indian equities through the month, with crude oil prices staying high.
A handful of large IT and banking shares carried the benchmarks, while most other stocks, and mid and smallcaps in particular, declined.
Background, longer periods: the Nifty 50 is down 7.42% over three months and down 12.22% year to date. The Nifty Smallcap 250 is up 2.50% year to date.
2. 🎯 Style and Factor Indices: Quality and Low Volatility Gained, Momentum and Alpha Declined
Only the two defensive factor indices built from the Nifty 100 ended higher; every momentum, alpha and multi-factor index ended lower.
Factor indices pick stocks by a shared trait: quality (profitability and balance-sheet strength), low volatility (steadier share prices), momentum (recent price strength) or alpha (returns above what the market's risk would explain). Multi-factor indices combine several traits.
The Nifty 100 Quality 30 rose 1.47% and the Nifty 100 Low Volatility 30 rose 0.57%.
Momentum indices fell by more. The Nifty 200 Momentum 30 declined 2.70% and the Nifty Midcap150 Momentum 50 declined 1.55%. The Nifty Alpha 50 fell 1.62%, and the three multi-factor indices fell between 1.23% and 1.35%.
Read with the size pattern above, the numbers show that selections built around larger, steadier companies held up better than those built around recent price strength.
Background, longer periods: over three months every index in this group is lower, by between 2.75% and 10.43%. Year to date, the Nifty Alpha 50 (+5.76%) is the only one in the group with a positive return.
3. 🏦 Fixed Income and Inflation: Indian Yields Rose While US Yields Fell
India's yields rose at every maturity on our dashboard, and US yields fell at every maturity.
India
The 6-month Treasury bill yield rose 56.9 bp to 6.51%, the 3-year yield rose 53.9 bp to 7.25%, the 5-year yield rose 44.9 bp to 7.31% and the 10-year yield rose 19.3 bp to 7.38%.
Shorter maturities rose the most, as they sit closest to the repo rate. The RBI's rate increase and its shift to calibrated tightening started the move. Hawkish comments from the Governor and inflation worries linked to higher crude oil prices kept yields climbing through the weeks that followed.
United States
The 6-month Treasury bill yield fell 4.7 bp to 4.29%, the 1-year yield fell 15.6 bp to 4.39%, the 5-year yield fell 37.7 bp to 4.71% and the 10-year yield fell 38.3 bp to 4.91%. Longer maturities fell the most.
As the month went on, investors moved money out of AI-linked technology shares and into government bonds, which pulled yields lower. The Federal Reserve then held its target range at 3.75% to 4.00% at its end-of-month meeting. The vote was 10-2, with the two dissenters preferring a quarter-point increase.
Inflation
India's CPI inflation was 4.38% in June, 4.45% in July, 4.82% in August and 5.54% in September, a rise of 0.72 percentage points in the latest month.
US inflation was 3.50%, 3.40%, 3.40% and 3.70% over the same months, up 0.30 percentage points in September. The September reading came in above expectations and raised the odds of a further Fed increase.
The two bond markets responded to different forces: domestic tightening and inflation in India, and a shift of money towards government bonds in the US.
Background, six-month change: the India 6-Month Treasury Bill yield is up 107.6 bp and the US 10-Year yield is up 52.9 bp.
4. 🌏 Global Markets: AI-Linked Technology Shares Weighed on the US, Japan and Hong Kong and the UK Gained
Concerns about returns on AI spending pulled technology shares lower in the US, Japan and Hong Kong, while the DAX and the FTSE ended the month higher.
United States
The S&P 500 rose 0.90%, while the more technology-heavy Nasdaq 100 fell 2.52%. The month's theme was doubt about how long heavy AI investment can continue.
A chip-led sell-off in technology shares came first. Meta's shares then fell after its results and a plan to issue non-voting shares to fund AI spending. Towards month-end, Alphabet's results disappointed investors and its shares fell sharply in after-hours trading.
Japan and Hong Kong
Japan's Nikkei fell 5.35%, with AI-related shares leading the declines on the same concerns about returns on AI investment.
The Hang Seng fell 6.72%, the largest decline on the dashboard. The month opened with its steepest one-day fall since March, as financial stocks dropped on rising global bond yields, a Fed seen as more hawkish than expected, and a pause in mainland investor flows for the National Day holiday.
Fading hopes of new stimulus from Beijing then pulled technology shares lower coupled with the AI-return doubts that had hit US and Japanese shares reaching Hong Kong technology names including Tencent, SMIC and Lenovo.
Europe
The DAX rose 3.34%, the FTSE rose 1.09% and the CAC 40 rose 0.07%.
Third-quarter results carried European shares. Aixtron and Nordex beat expectations, and earlier results from ASML and Ericsson had already lifted sentiment, which helped the market absorb the technology sell-off in the US and Asia. The CAC 40 ended almost unchanged, with French bond-market volatility in focus ahead of the European Central Bank's meeting.
The month's weakest indices were those most closely tied to technology shares, with China-specific factors adding to the decline in Hong Kong.
- 📈 S&P 500, United States (+0.90%)
- 📉 Nasdaq 100, United States (-2.52%)
- 📉 Nikkei, Japan (-5.35%)
- 📈 DAX, Germany (+3.34%)
- 📈 CAC 40, France (+0.07%)
- 📈 FTSE, United Kingdom (+1.09%)
- 📉 HangSeng, Hong Kong (-6.72%)
Background, year to date: the Nikkei is up 26.71%, the S&P 500 is up 12.78%, the Nasdaq 100 is up 12.66% and the Hang Seng is down 10.42%.
5. 💱 Currency and Commodities: A Stronger Rupee, Higher Brent and Lower Domestic Gold
The rupee gained against the dollar and Brent crude ended higher, while domestic gold fell 2.91%.
Rupee
USD-INR ended at 95.08, against 96.05 a month earlier, a change of -0.97 or -1.01% .A lower USD-INR number means a stronger rupee, because fewer rupees are needed to buy one dollar.
The path was uneven. The rupee weakened after the RBI's rate decision early in the month, as crude oil rebounded. Foreign-exchange measures from the RBI, including a dollar window for state-run oil marketing companies, then helped steady it, and RBI intervention supported further gains.
Brent crude: key themes
Brent ended at 112.39 USD/barrel against 103.53 a month earlier, a rise of 8.86 USD or 8.56% . Supply risk in the Gulf was the common thread.
- Attacks on shipping. Attacks on vessels near the Strait of Hormuz increased through the first half of the month, and doubts over Russian diesel supply added to the concern.
- Energy infrastructure. An attack on the headquarters of Saudi Arabia's state oil company, and Iranian statements about new tactics against ships, added to the strain. Later, Houthi attacks in Saudi Arabia took Brent to a five-month high.
- Easing at month-end. Crude fell as diplomatic efforts reduced fears of further disruption to Gulf supplies, and fell again on hopes of peace talks between the US and Iran.
Gold: key themes
Domestic gold returned -2.91%. The dashboard gives gold as a return only, so the themes below describe what moved gold in international markets, which feeds into the rupee price. Gold pays no interest, so when markets expect higher interest rates, bonds become more attractive relative to it.
- A firmer dollar and elevated Treasury yields. Gold began the month under pressure from both.
- Hotter US inflation lifted Fed hike bets. A US inflation reading above expectations led traders to price a higher chance of a Fed rate increase and firmed the dollar. Gold fell for a third straight session.
- Oil and inflation. As Brent climbed to a five-month high, gold fell to a three-month low. Higher oil prices can keep real (after-inflation) interest rates elevated for longer, which reduces gold's appeal.
- Relief as yields and oil eased. Gold recovered ground as US Treasury yields retreated and, later, as lower crude prices eased worries about Fed tightening.
- The Fed on hold, with a hike still possible. The Fed held rates and put off any change until after the US midterm elections. Markets still priced a high chance of a December hike, and gold slipped again ahead of the Fed's preferred inflation data, on course for a second straight monthly decline.
- A stronger rupee. All else equal, the rupee's 1.01% gain against the dollar lowers the rupee price of gold.
Background, longer periods: domestic gold returned -0.38% over three months and 5.00% year to date. Brent's three-month and year-to-date reference levels on the dashboard are 89.03 and 60.75.
Until next month, 👋 bye! 🌟



0 Comments