
If you are looking to track different market-related indicators in one single place, we have good news for you
We are delighted to launch Samasthiti Advisors’ Weekly Market Tracker. Our Weekly Market Tracker skims through diverse sources and brings together all the relevant market indicators in one single place. Going forward, we will release this Tracker every week with the updated data.
Read below for a brief description of all the data you can track in our Market Tracker.
Indian Equity Market
The Tracker has data on 18 different indices that track different segments of the Indian equity market. We have broken down these 18 indices into the following categories,
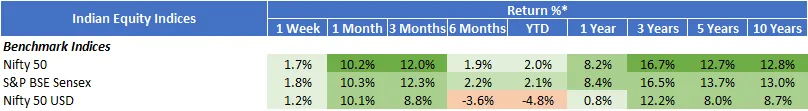
Benchmark Indices
This section covers the most widely used indices for tracking the pulse of the Indian equity markets – the Sensex and the Nifty 50. The Sensex tracks the equity performance of the top 30 top companies in India and the Nifty 50, as the name implies, tracks the performance of the top 50 companies in India.
As an addition, and to spice things up, we have also included data for the Nifty 50 USD, which shows the performance of the Nifty 50 in USD terms. When the INR appreciates, the return for Nifty 50 will be higher than Nifty 50 USD, and vice-versa.
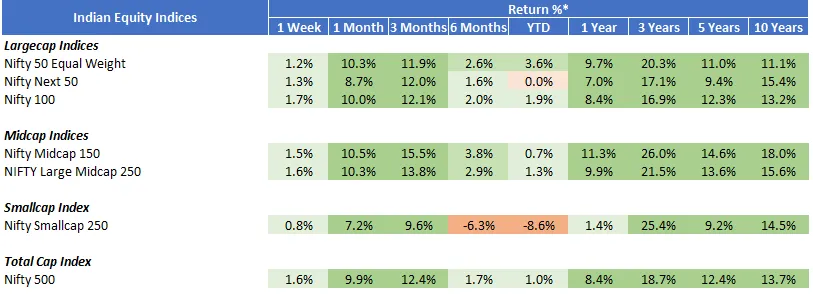
Large-cap, Mid-cap, Small-cap and Total-cap Indices
Tracking the benchmark indices is helpful – one look at the benchmarks and you get an idea about how the equity markets are doing. However, if you want to look under the hood and see which segment of the equity market has performed better, you will have to look beyond the benchmark indices. In this segment, you can look at indices that separately track the performance of large, mid and small sized companies.
As a bonus, we have also included the total-cap index, which tells you how the broader market, encompassing all segments, is performing.
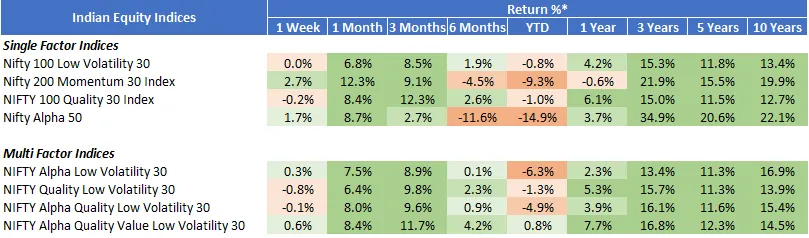
Single-factor and Multi-factor Indices
The last few years have seen a healthy growth in factor investing. In factor investing, stocks are selected based on giving the overall portfolio a factor tilt. There are many factors which investors use – like growth, value, momentum, low volatility, etc. If you want to see how these factors have performed in the Indian equity market, we have included 8 different factor indices for you to track.
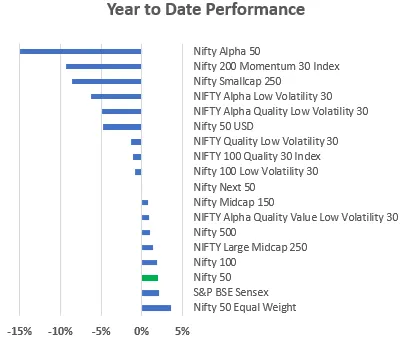
To summarize the recent performance of the equity markets in India, the Tracker includes a bar graph ranking the year-to-date performance of the most prominent equity indices in India.
Get this Market Tracker delivered to your WhatsApp every week. Since we have limited broadcasting facility over WhatsApp, subscribe NOW!
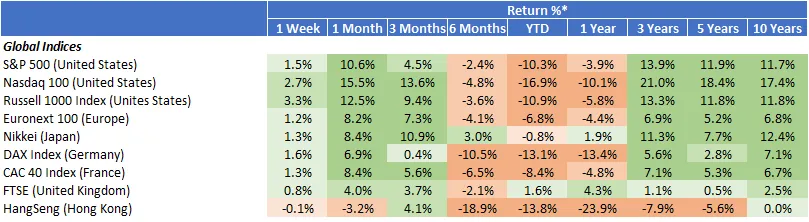
Global Equity Markets
In our globalized world, what happens at one part of the world has an impact on some other part of the world. This holds even more true for the equity markets. How the Indian equity market performs also depends on some prominent global equity markets. We have, accordingly, selected the major global equity indices for you to track. The regions covered are – United States, Europe (overall), Germany, France, United Kingdom, Japan and Hong Kong. We have selected the most important and widely tracked equity indices that give you a pulse of what is happening in the equity markets in these regions.
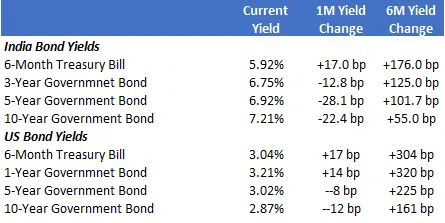
Debt Markets
Tracking the equity markets is incomplete without keeping an eye on what is happening in the debt markets. Both the equity markets and the debt markets are reflexive – they both influence each other. The most important metric to track in the debt markets are the yields on government bonds of different tenures. We have included these metrics not only for India but also for the United States as interest rates in the United States have a significant impact on equity markets across the world. This segment tracks the current yield on government bonds compared to the yield over the previous 1-month and 6-month period.
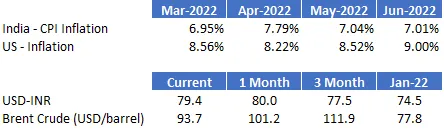
Other Indicators
The other indicators present in the Tracker are – inflation (both in India and in the US), exchange rate between the Indian Rupee (INR) and the US Dollar (USD), and the price of crude oil. Apart from tracking the equity and the debt markets, the above-mentioned indicators are the most important macro-economic variables tracked in the investment community.
Full Market Tracker
The full Market Tracker combining all the above segments and indicators can be seen below,
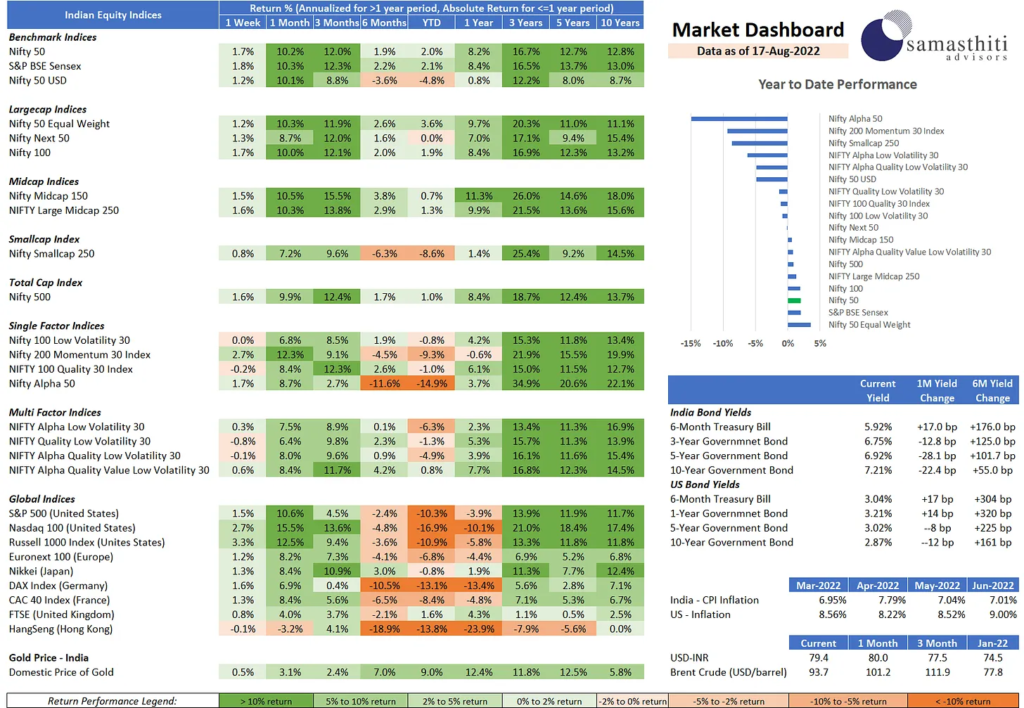
We have curated this Tracker with a lot of thoughtful consideration and there’s something in it for everyone. We would love to hear your feedback on how we can make it more useful for you – leave a comment below or drop an email at support@samasthiti.in
Get this Market Tracker delivered to your WhatsApp every week. Since we have limited broadcasting facility over WhatsApp, subscribe NOW!


Hi,
Can you add two more Indices – Midcap 150 Quality 50 and Nifty 50 Value 20.
Also, are the global indices returns in INR?