
| Equity Allocation | Retirement Period | ||||
| 20 years | 30 years | 40 years | 50 years | 60 years | |
| 0% | 5.4% | 3.8% | 3.0% | 2.5% | 2.2% |
| 10% | 5.5% | 3.9% | 3.1% | 2.6% | 2.3% |
| 20% | 5.3% | 3.8% | 3.1% | 2.7% | 2.4% |
| 30% | 5.2% | 3.7% | 3.1% | 2.7% | 2.4% |
| 40% | 5.0% | 3.6% | 3.0% | 2.6% | 2.4% |
| 50% | 4.7% | 3.5% | 2.8% | 2.6% | 2.3% |
| 60% | 4.5% | 3.3% | 2.8% | 2.5% | 2.2% |
| 70% | 4.3% | 3.2% | 2.5% | 2.3% | 2.1% |
| 80% | 4.2% | 3.0% | 2.5% | 2.1% | 2.0% |
| 90% | 3.9% | 2.9% | 2.4% | 2.1% | 1.7% |
| 100% | 3.8% | 2.5% | 2.1% | 1.8% | 1.7% |
Source: Samasthiti Advisors
Interpretation: First year withdrawal at x% of corpus, withdrawals in subsequent years to be increased as per inflation. Please note that safe withdrawal rate is not the rate of annual withdrawal from corpus, but only the withdrawal rate in the first year of retirement.
Note:
1) The above safe withdrawal rates have been obtained from 10,000 simulations for each equity allocation, based on actual equity returns, debt returns, and inflation as recorded over the last 24 years. The reason for not going further back in history is explained here. Sensex price returns have been used for equity returns, average 1-3 year Fixed Deposit rates have been used for debt returns and CPI data has been used for inflation.
2) Tax rate has been assumed at 12.5% long term capital gain tax for both equity and debt. For debt, the actual capital gains tax is higher. However, the 12.5% rate has been retained for debt as well since Indian retirees seeking tax efficiency can allocate their fixed income exposure through arbitrage funds, hybrid funds and/or multi-asset funds, thereby qualifying for equity-like taxation.
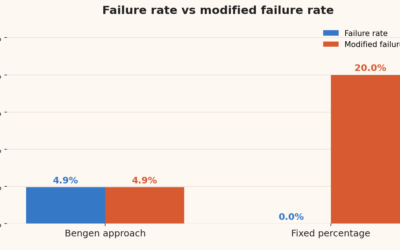
3) The failure rate has been set at 5% ± 20bps. A narrower deviation than ± 20bps would lead to a higher number of iterations for arriving at a solution with debatable benefit of the increase in precision. Accordingly, it is advised not to place too much importance on small changes in withdrawal rates for different combinations of equity allocation/retirement periods.
4) The computations assume monthly withdrawals and monthly rebalancing. Using bucket strategy will not lead to an improvement in the above withdrawal rates for reasons mentioned here.
4) As can be noticed, as equity allocation increases, the withdrawal rates go up but soon starts falling. To understand why this happens, please see here. You can also notice that longer retirement periods allow for higher equity allocation.
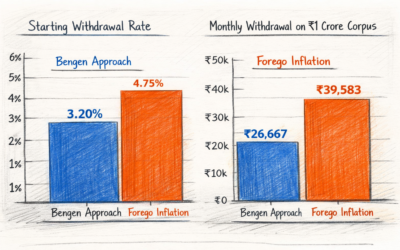
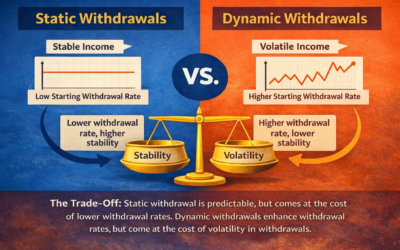
5) The above withdrawal rates are for static withdrawals with inflation adjustments. Dynamic/adaptive withdrawals can potentially permit higher withdrawal rates. You can explore such strategies here.


The table with SWR mentioned in page https://samasthiti.in/safe-withdrawal-rates-ready-reckoner/ are different values when SWR is computed using stochastic approach in the page https://retirement-calculator-cd-296630626707.us-central1.run.app/stochastic
Can you explain why?
SWR is computed using stochastic approach in the page https://retirement-calculator-cd-296630626707.us-central1.run.app/stochastic suggested that, for 50 years (600 months) in retirement, the equity allocation of 30% has 2.11% SWR, 40%/50%/60% all the 3 has 2.26% SWR and 70% has 1.98%. But interested to know why for a wide range from 40-60%, the SWR was same at 2.26%? Also, what does Expenditure Cover Ratio mean? How to use it?
Can you explain why?
SWR Ready Reckoner table has very diff SWR compared to using the Stochastic approach calculator? Why?