
This post is based on our research study titled “Boosting Retirement Income through Dynamic Withdrawals” which can be accessed here.
In our previous post, we covered the forego-inflation strategy that skips inflation adjustments in years when the portfolio declines. This strategy keeps the basic structure of static withdrawals intact and introduces just one rule.
In this post, we move further into dynamic withdrawal territory with the fixed percentage withdrawal strategy. This approach does away with inflation adjustments entirely and instead ties every year’s withdrawal directly to the current value of your portfolio.
We will evaluate the fixed percentage strategy using the same four-dimensional framework we applied to the forego-inflation strategy. As we will see, this approach solves one problem decisively but creates a different, equally serious one in its place
What Is the Fixed Percentage Withdrawal Strategy?
The rule is very simple. Each year, withdraw a fixed percentage of whatever your retirement corpus is worth at that moment. If you choose 3.2%, and your corpus is worth ₹1 crore, you withdraw ₹3.2 lakh that year. If the next year your corpus has grown to ₹1.1 crore, you withdraw ₹3.52 lakh (3.2% of ₹1.1 crore) and if it has fallen to ₹85 lakh, you withdraw ₹2.72 lakh (3.2% of ₹85 lakh).
Every single year, the withdrawal is recalculated from scratch based on current portfolio value. There is no memory of what you withdrew last year, no inflation adjustment, no smoothing. The market goes up, your income goes up. The market goes down, your income goes down. The strategy is a pure and unfiltered reflection of portfolio performance.
This withdrawal style has one remarkable mathematical consequence. The portfolio can never run out of money. If your corpus falls to ₹10 lakh, your withdrawal falls to ₹32,000. If it falls to ₹1 lakh, your withdrawal falls to ₹3,200. However small the portfolio becomes, you are always taking a fraction of what remains, never the whole thing. Depletion is mathematically impossible.
The trade-off is immediate and obvious. Your income is no longer predictable from one year to the next. It depends entirely on market returns, and in a bad year, or a bad decade, that income can fall significantly below what you planned for.
A Realistic Example
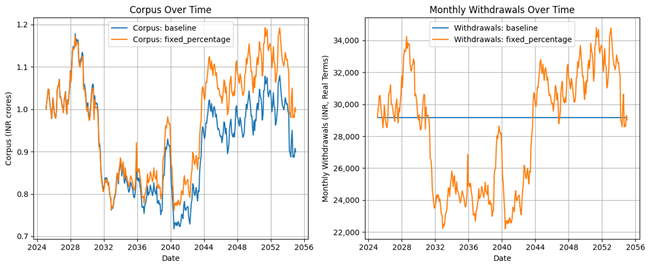
To see how the fixed percentage strategy behaves in practice, we randomly generated a sequence of market returns and inflation rates and tracked the results over 30 years. In the figure below, the left panel shows what happens to the corpus under the fixed percentage strategy versus the constant inflation-adjusted (Bengen-style) approach (labelled as Baseline in the graph). The right panel shows monthly withdrawals in real terms, that is, adjusted for inflation to reflect actual purchasing power.
Fixed Percentage Strategy vs. Bengen Approach (Constant Inflation-Adjusted Withdrawals)
Source: Saraogi, R. (2025). Boosting Retirement Income through Dynamic Withdrawals
Note: The fixed percentage strategy links each year’s withdrawal directly to portfolio value. In a strong bull market, real income can climb well above the starting level. In a sustained downturn, the same mechanism compresses real income, potentially to a fraction of what the retiree expected. The Bengen approach, by contrast, delivers perfectly stable real income until the portfolio is exhausted.
The two strategies diverge sharply in character. The Bengen approach (Baseline) is a flat line on the withdrawal chart, reflecting same real income, year after year. The fixed percentage strategy is a volatile line that tracks every market swing. In good conditions it can climb well above the Bengen approach’s steady income. In bad conditions it descends, sometimes steeply, and never fully recovers until markets do.
A Closer Look at Performance Metrics
When evaluating dynamic withdrawal strategies, just looking at the failure rate is not sufficient. A strategy that keeps your portfolio intact by slashing your income by half technically “succeeds”, but that is cold comfort if you cannot meet your basic expenses. To evaluate properly, we use a four-dimensional framework developed in our research:
- Spending — how much income does the strategy actually deliver over time?
- Stability — how volatile is that income from year to year?
- Savings — how much wealth remains at the end for legacy or emergencies?
- Sustainability — what is the risk of the plan failing?
Spending: A Wide Range of Outcomes
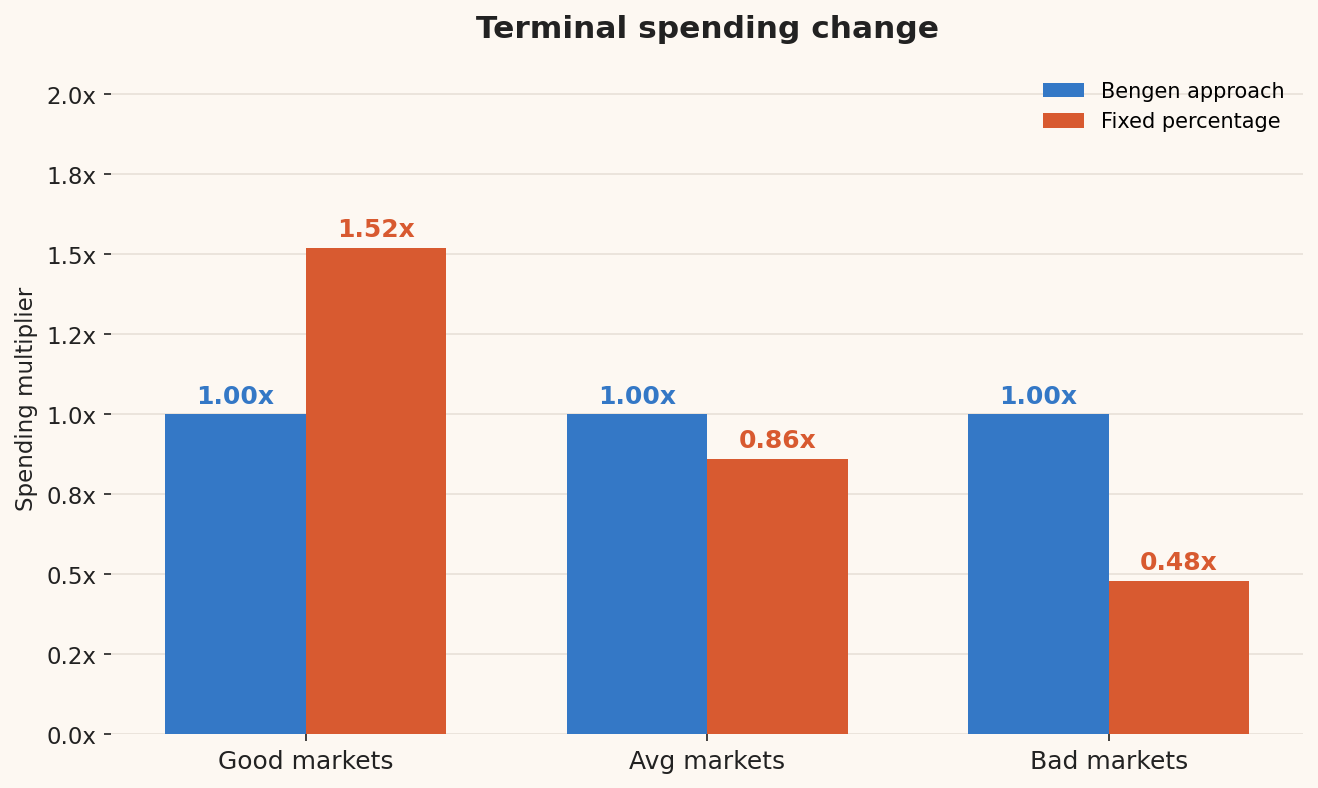
The defining characteristic of the fixed percentage strategy on the spending dimension is its wide dispersion. In good markets, the portfolio compounds strongly, and since each year’s withdrawal is a fraction of that growing portfolio, real income climbs steadily. By Year 30 in a good market, the fixed percentage retiree is withdrawing 1.52x their starting real income, comfortably ahead of where they began.
In average markets, the picture is more sobering. The year-30 withdrawal settles at 0.86x the starting level, a modest decline that most retirees could manage. But in bad markets, income falls to 0.48x, which is less than half the starting purchasing power. That is a compression that could be genuinely difficult to live with.
Source: Saraogi, R. (2025). Boosting Retirement Income through Dynamic Withdrawals
Note: Terminal spending change measures how much your real (inflation-adjusted) withdrawal in Year 30 has changed compared to what you started with at retirement. A value of 1.0 means purchasing power is unchanged. A value of 1.52 means real income has grown by 52%. A value of 0.48 means real income has fallen to 48% of its starting level. Good markets = 90th percentile of outcomes; Avg markets = median; Bad markets = 10th percentile.
Savings: Strong Preservation in the Worst Scenarios
This is where the fixed percentage strategy’s core logic pays off most clearly. Because withdrawals automatically shrink when the portfolio falls, the portfolio is protected from the vicious cycle that can destroy a static withdrawal strategy in which a falling market forces high relative withdrawals, which depletes the corpus further, which amplifies losses in the next downturn.
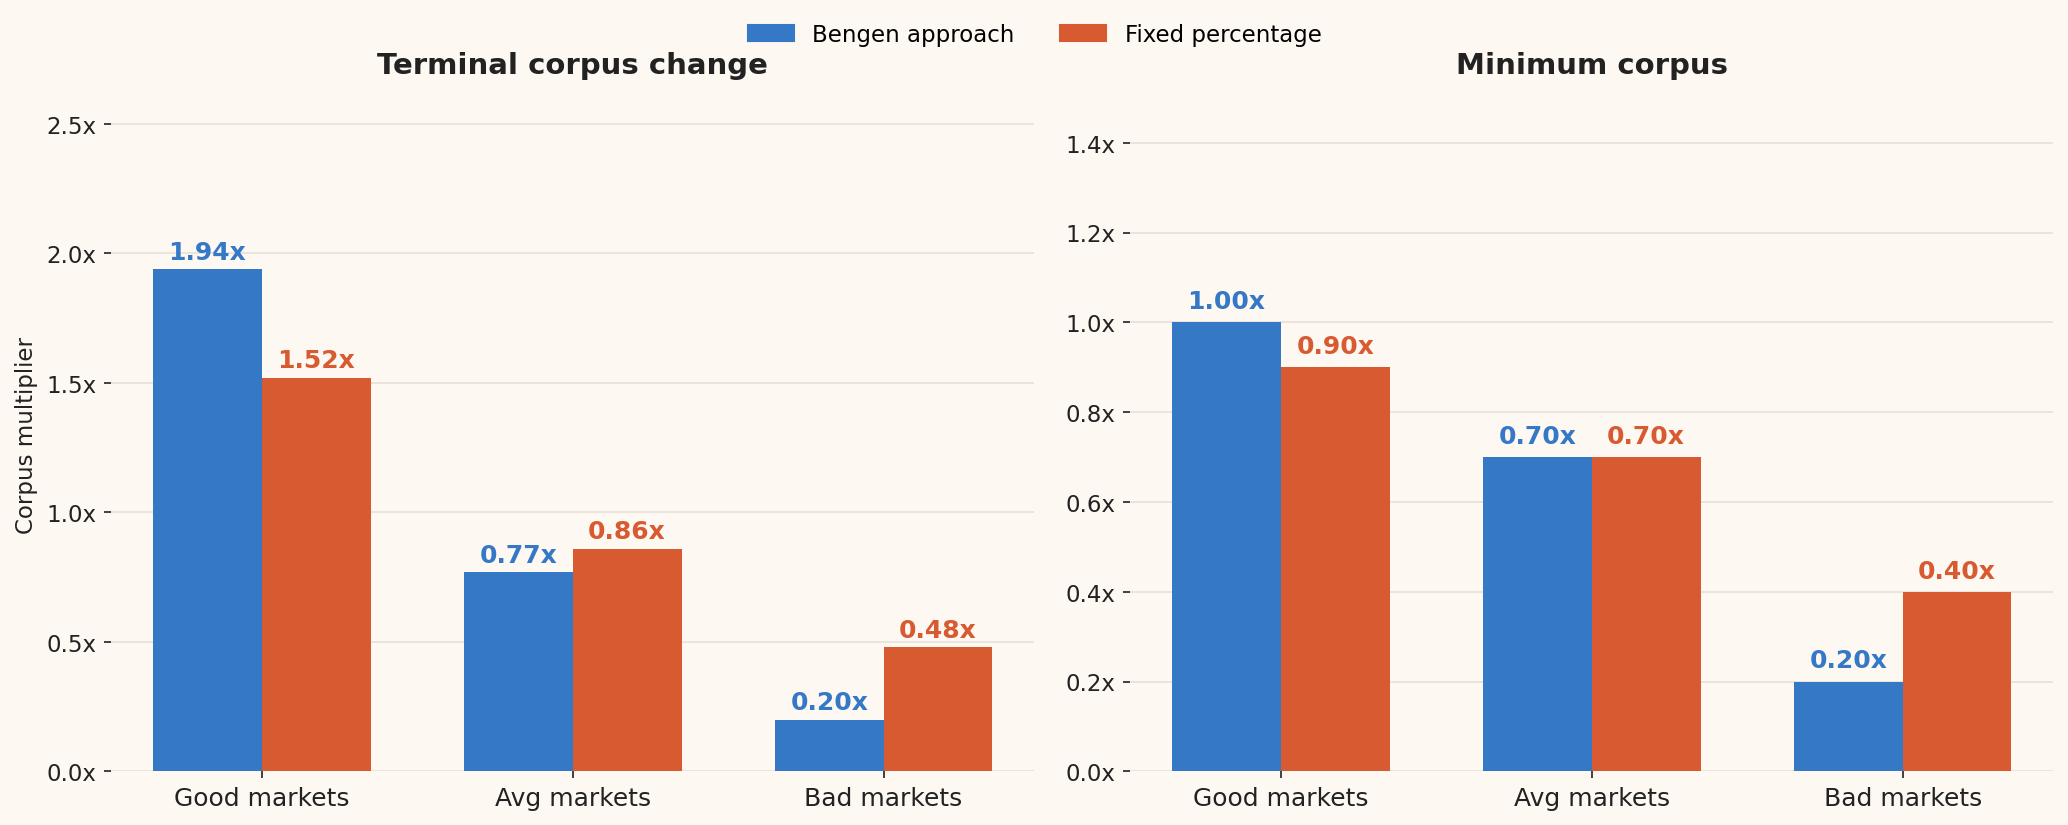
In bad markets, the fixed percentage strategy ends 30 years with 0.48x of the original corpus, compared to just 0.20x for the Bengen approach. That is more than double the remaining corpus in the very scenario where preservation matters most. In average markets, the Bengen approach ends at 0.77x while fixed percentage ends at 0.86x. Only in good markets does the Bengen approach pull ahead on terminal corpus (1.94x vs 1.52x), because the Bengen retiree is not drawing higher real income even when their portfolio shows strong compounding.
Source: Saraogi, R. (2025). Boosting Retirement Income through Dynamic Withdrawals
Note: (1) Terminal corpus change measures the value of your portfolio at the end of 30 years relative to what you started with. A value above 1.0 means it has grown; below 1.0 means it has shrunk. (2) Minimum corpus captures the lowest point your portfolio reaches at any time during the 30-year retirement, expressed as a proportion of the starting corpus. Good markets = 90th percentile; Avg markets = median; Bad markets = 10th percentile.
The minimum corpus metric reinforces this story. In bad markets, the Bengen approach allows the portfolio to fall as low as 0.20x at its worst point — a terrifying 80% drawdown from the starting value. The fixed percentage strategy, by automatically reducing withdrawals as the portfolio shrinks, holds the minimum corpus at 0.40x. Still a significant drawdown, but one that is far more likely to be survivable.
Sustainability: Zero Ruin, But a High Modified Failure Rate
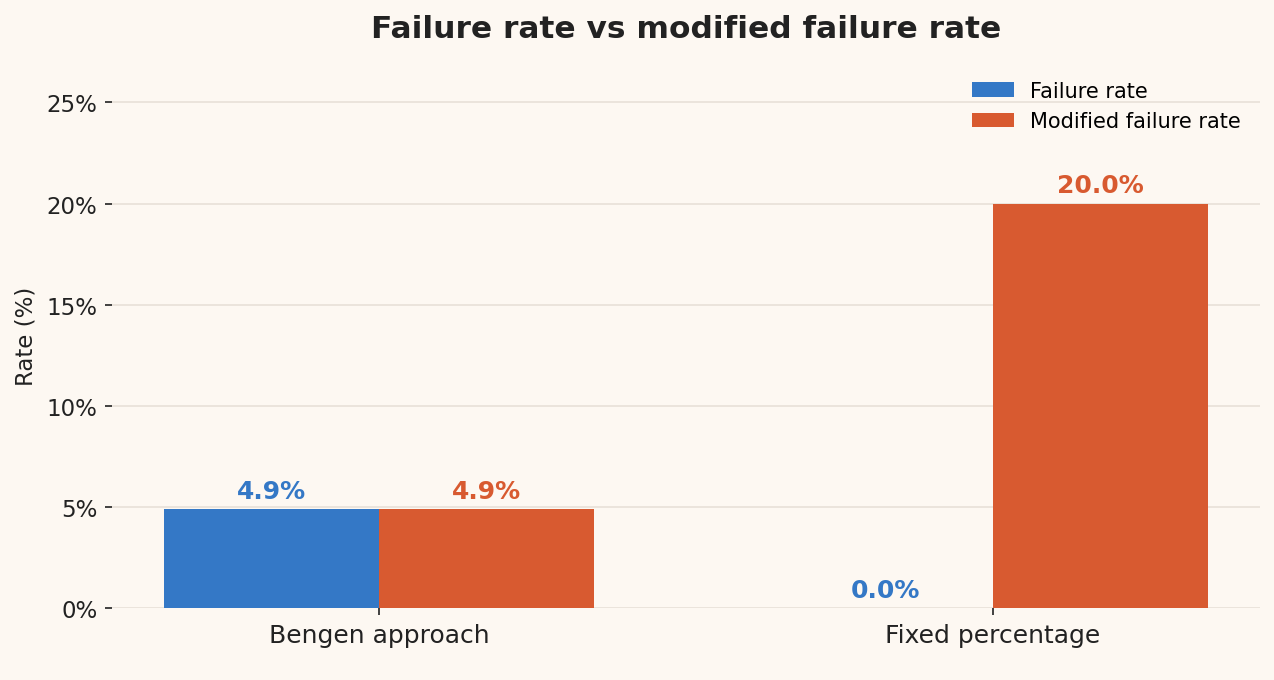
On the traditional failure rate, the fixed percentage strategy is mathematically perfect. The failure rate is 0% in our simulations. As explained earlier, this is built into the strategy by design. If you can never withdraw more than a fraction of what remains, the portfolio can never reach zero.
But the modified failure rate tells a very different story. At 20%, it is high but significantly lower than the modified failure rate of 59% under the forego-inflation approach. The modified failure rate captures simulations where withdrawals fall below a minimum income threshold for a sustained period, even if the portfolio technically survives. That is precisely what happens to a fixed percentage retiree in a bad market. The portfolio survives, but income keeps falling until it may no longer covers essential expenses.
Source: Saraogi, R. (2025). Boosting Retirement Income through Dynamic Withdrawals
Note: Failure rate = % of simulations where portfolio ran out of money. Modified failure rate = % of simulations where portfolio ran out OR spending fell below minimum threshold for a sustained period.
The gap between 0% and 20% is the central paradox of the fixed percentage strategy. The money never runs out, but in one in five scenarios, the retiree effectively experiences a lifestyle failure, which is a sustained period of income so low that retirement cannot be lived as planned. This is why the traditional failure rate, useful as it is for static strategies like the Bengen approach, is genuinely inadequate for evaluating the fixed percentage strategy.
The Bengen approach, with its 4.9% failure rate, exposes the retiree to a small but real risk of complete financial ruin. The fixed percentage strategy replaces that risk with a roughly one-in-five chance of sustained income compression that may be indistinguishable from failure in the retiree’s day-to-day life.
Volatility: The Hidden Cost of Market-Linked Income
The sustainability metrics tell us whether a strategy survives. The volatility metrics tell us how uncomfortable the journey is likely to be, even in scenarios where it does.
Two metrics capture this. The spending floor breach measures the proportion of retirement months in which your withdrawal falls below two-thirds of your planned starting income. The standard deviation of withdrawals measures how erratically your income changes from year to year. Both metrics are shown across the distribution of simulation outcomes. The 10th percentile reflects a relatively benign experience, the median a typical one, and the 90th percentile a more difficult one.
Volatility – How stable is income during retirement?
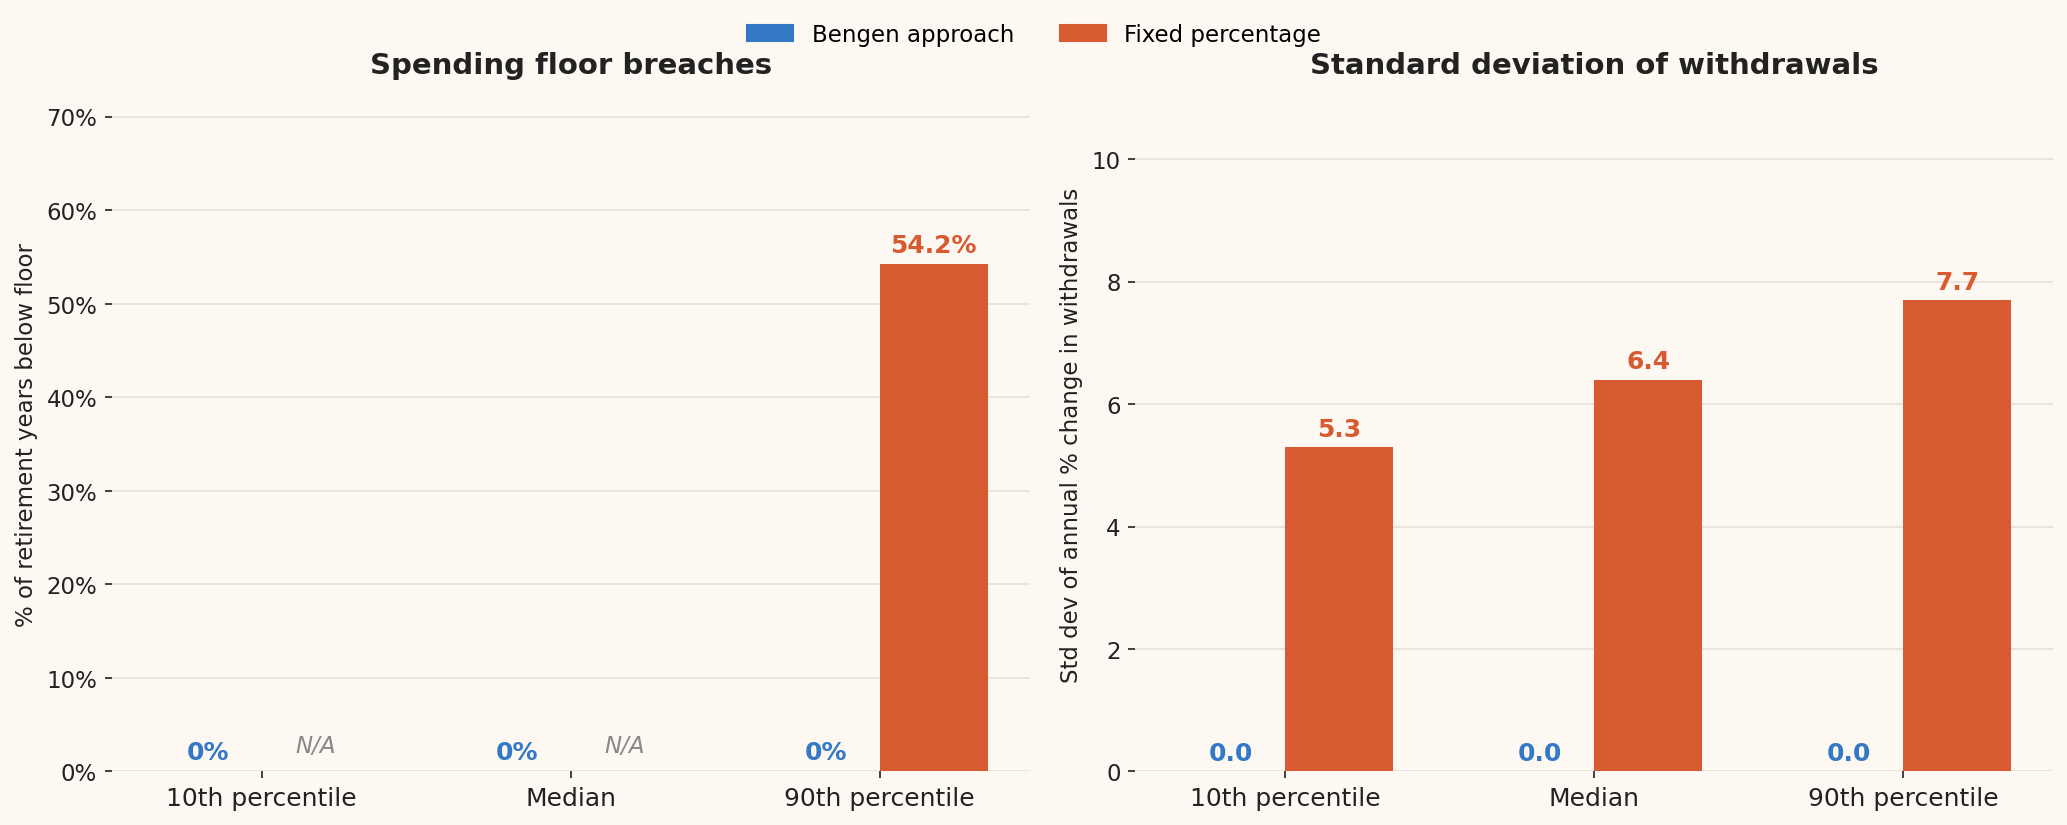
Source: Saraogi, R. (2025). Boosting Retirement Income through Dynamic Withdrawals.
Note: Spending floor breaches = % of retirement months where withdrawals fall below two-thirds of planned starting income. Standard deviation of withdrawals = standard deviation of the annual percentage change in real withdrawals; a value of 0 means income never changed, higher values indicate greater year-to-year volatility. Percentiles describe the distribution of each metric across all simulations — the 90th percentile represents the most challenging 10% of outcomes. N/A = not observed in those simulations.
The Bengen approach records zero on both metrics across all percentiles. Because it never voluntarily adjusts withdrawals, income is perfectly stable year to year and there are no floor breaches and no withdrawal volatility.
The fixed percentage strategy is markedly different. On spending floor breaches, the picture is concentrated entirely at the extreme end of the distribution. In a typical simulation (median) and even in the most favourable 10% of outcomes, spending floor breaches simply do not occur. The fixed percentage strategy, for all its volatility, manages to stay above the critical income threshold in most simulations most of the time. But in the worst 10% of outcomes, the retiree spends 54.2% of their retirement years below the essential income floor. That is more than half a retirement spent in financial hardship, despite the portfolio never running out of money. Spending floor breaches are therefore a tail risk for this strategy. It’s a rare across simulations, but severe when they do materialise.
The standard deviation of withdrawals shows a consistent pattern across the full distribution. In the most favourable 10% of simulations, the annual withdrawal change has a standard deviation of 5.3. In a typical simulation it is 6.4, and in the most difficult 10% it rises to 7.7. The Bengen approach sits at zero throughout. This spread tells us that income unpredictability is not just a bad-scenario problem for the fixed percentage retiree but it is present in every simulation and simply varies in degree.
Starting Withdrawal Rate: No Advantage Here
The fixed percentage strategy is somewhat unusual in that varying the starting withdrawal rate is not a particularly meaningful exercise for it. Because the withdrawal each year is a direct function of portfolio value, a higher starting rate does not give the retiree more income in the long run. It simply means a larger fraction is taken each year, and the portfolio grows more slowly as a result.
Who Is This Strategy For?
The fixed percentage strategy is best suited for retirees whose spending is genuinely flexible. If you have other income sources, like a pension, rental income, or family support that cover your non-negotiable expenses, then the fixed percentage strategy can serve as an opportunistic withdrawal from your investment portfolio. In good years you spend more, in bad years you pull back, and you never need to worry about running out.
It is also well-suited for retirees who place a high priority on not outliving their money and who are philosophically comfortable with the idea that their retirement lifestyle will fluctuate with market conditions.
It is a poor fit for retirees whose monthly expenses are largely fixed, like rent or EMIs, household help, medical costs and who need a predictable income floor. In a sustained downturn, the automatic cuts this strategy produces may fall well below what is needed to meet those obligations, leaving the retiree in a difficult position despite a portfolio that is technically intact.
Conclusion
The fixed percentage withdrawal strategy represents the most direct way to link retirement income to market performance. Its compelling promise is that your portfolio can never run out. In bad markets it automatically pulls back, protecting capital. In good markets it delivers more. There are no rules to remember, no decisions to make mid-year.
But that promise comes with a significant hidden cost. One in five retirees using this strategy in our simulations would experience a sustained compression of real income so severe that it effectively constitutes a retirement plan failure, even though the portfolio is technically still standing. The 0% traditional failure rate and the 20% modified failure rate together tell the honest story of this strategy that it solves one problem perfectly while leaving another largely unaddressed.
The fixed percentage strategy is therefore a useful foundation to understand, and it directly underpins several more sophisticated approaches, including the Bengen Hard Floor & Ceiling strategy, which we will cover in the next post.
This article is based on research that uses Indian market data and is for informational purposes only. It does not constitute investment advice. Please consult your financial advisor before making any investment decisions.


0 Comments