We have added a ton of new data. Don’t miss checking out our Tracker for this week!
Every week at Samasthiti Advisors we have been publishing our Weekly Market Tracker. This Tracker was being prepared as a single page document so that you can quickly glance at the relevant market indicators and how they panned out over the previous week.
Based on popular requests, we are now enhancing the Weekly Market Tracker with additional pages which provide historical data for interest rates, inflation, global equity indices, yield spread, rolling returns and much more.
Do check it out below 👇
Some interesting things you can see in our enhanced Tracker with historical data,
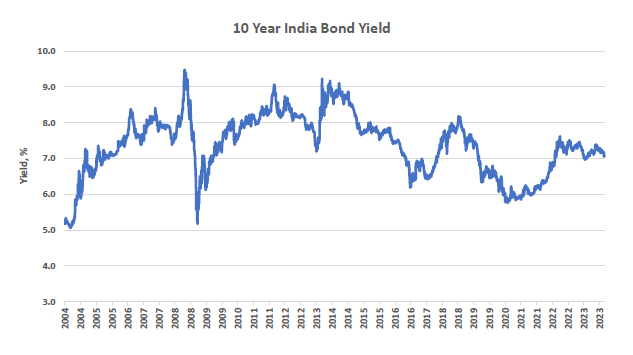
– You can see the steep spike in interest rates in the graph titled “India 10 Year Government Bond Yield” during the taper tantrums of 2013-2014. This was a period of heightened interest rate volatility that impacted overall financial markets stability.
– Also visible in the graph “US Consumer Price Inflation” is the sharp rise in US inflation from about 1% in 2020 to 9% in 2022 before settling down to about 3% now.

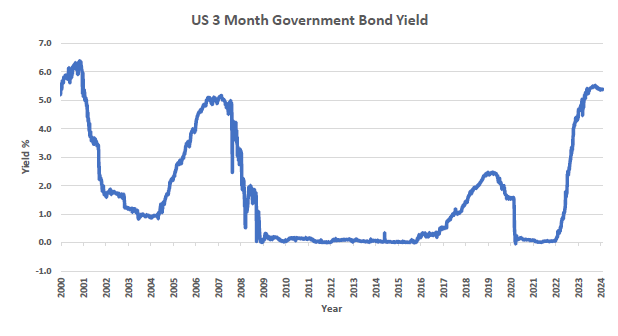
– The legendary zero-interest rate policy is visible in the graph “US 3 Month Government Bond Yield” graph, where interest rates are hugging the 0% line from about 2010 to 2016. The sharp increase in short term interest rates to more than 5% now is starkly visible.
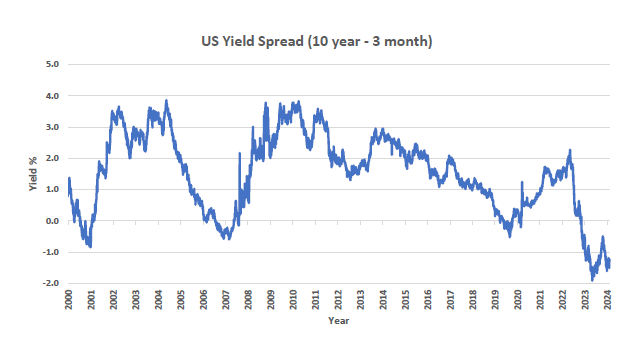
-The sharp increase in interest rates in the US also means that yield spread (the difference between long and short term rates) has turned negative. The yield spread in the US has not been in negative territory for more than a year now (look at the graph titled “US Yield Spread”. Generally, a negative yield spread is an indicator of future recession.
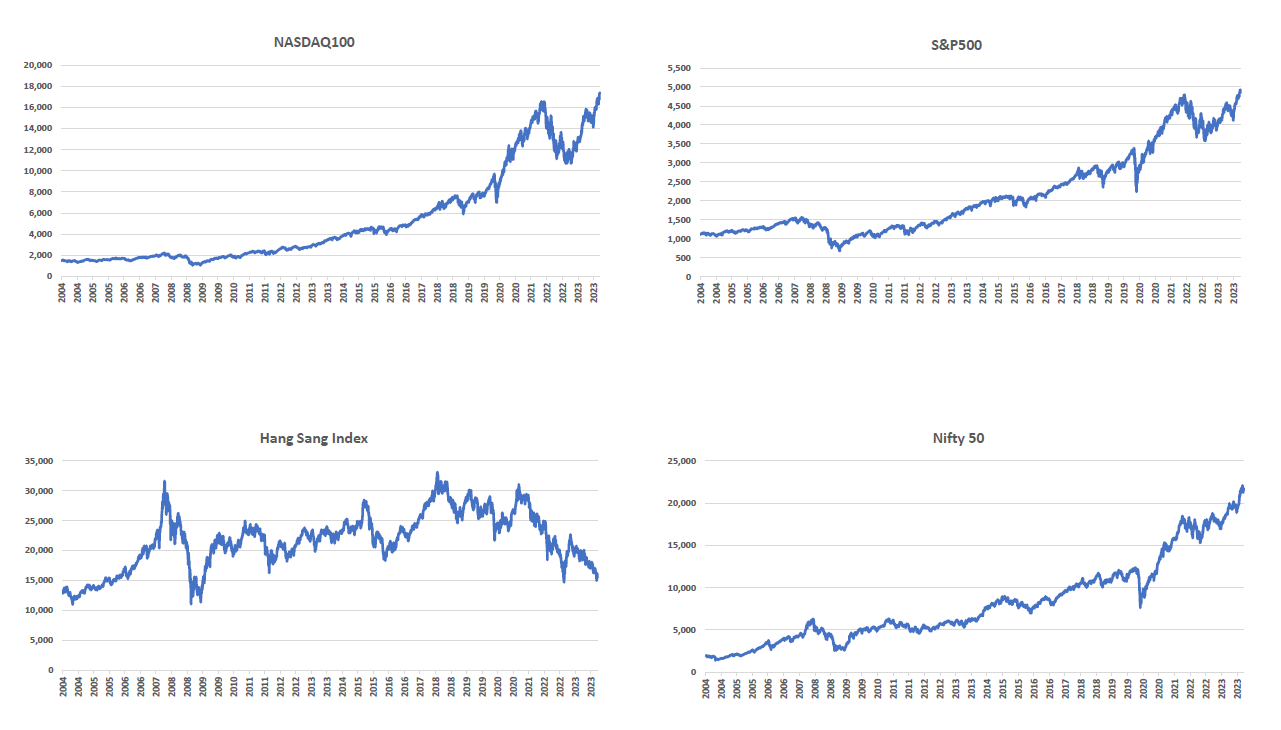
-You can also see the long-term performance of major equity indices like Nifty 50, S&P500, Nasdaq100 and the Hang Seng Index (in the page “Equity Market Indices”). You can see how the equity markets have created tremendous wealth for investors – but only for those investors who could withstand short term volatility.
-In the subsequent pages, you can see the 3 year, 5 year, 10 year and 15 year rolling returns for each of the above-mentioned equity indices. These rolling returns are an excellent source for guiding you how long you should be willing to hold your equity investments.
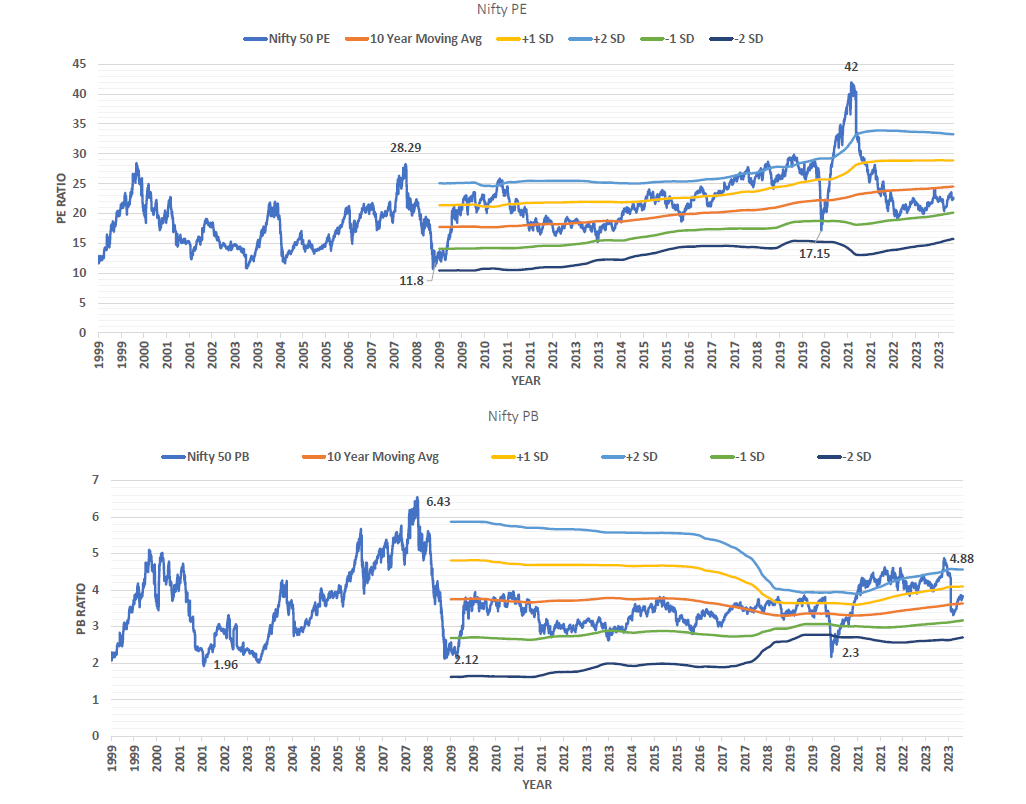
-Last, you can track the valuations of the Nifty Index – both the PE and the PB ratios, along with the historical standard deviations. With all the chatter around market overheating, you can check how the index valuations are currently as compared to the past.
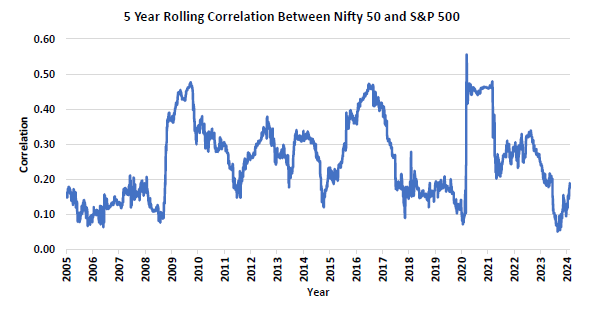
– We have plotted the 5 year rolling correlation between Nifty 50/Gold and Nifty50/S&P500. It is interesting to note that there is fairly strong positive correlation between Nifty50 and S&P500. As is visible in the graph below, all the datapoints are above zero and go up as high as 0.5 occasionally.
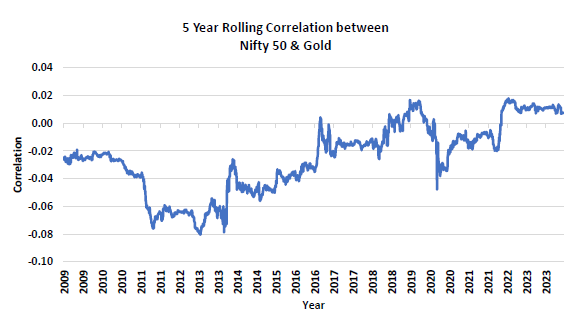
As a contrast, the 5 year rolling correlation of Nifty 50/Gold shows that the two assets are uncorrelated. As is visible in the graph below, most of the datapoints are below zero and hovering in that zone, displaying a lack of correlation.
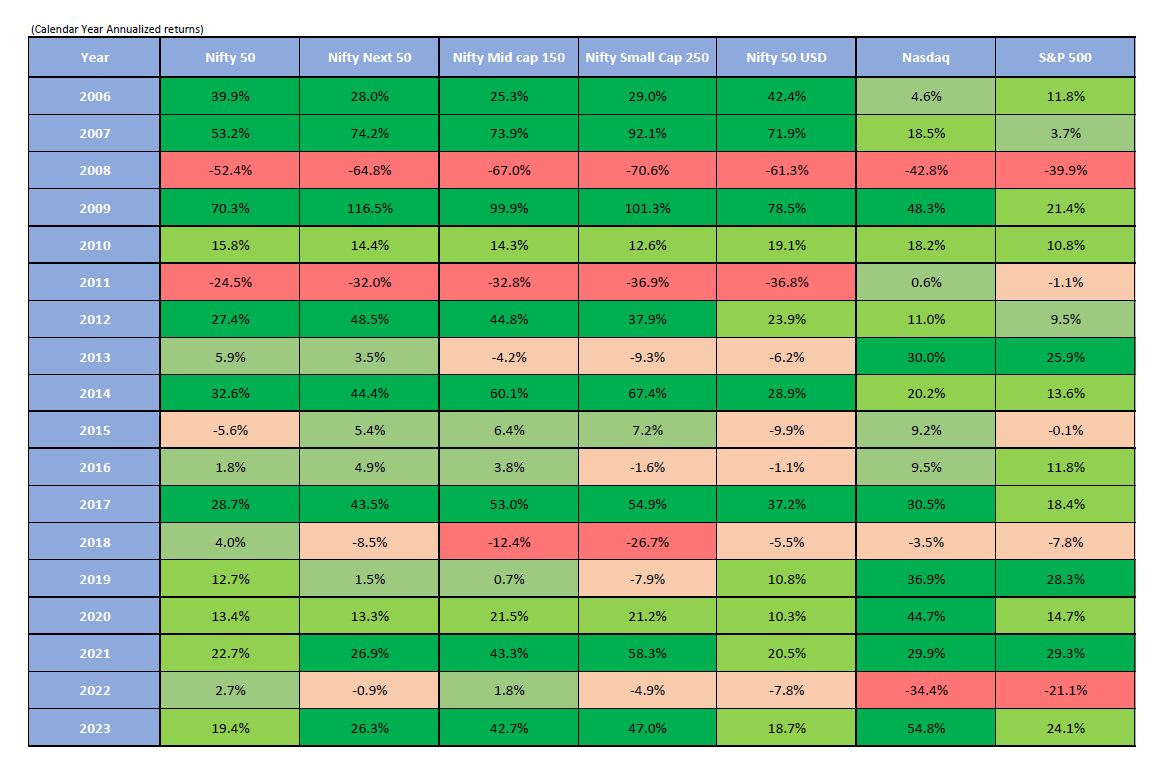
– We also have an additional page on the annual calendar year returns of major indices. The numbers in the graphic below express many stories – you can see the mindboggling returns in smallcaps, midcaps and NASDAQ. You can also see that Nifty 50 has produced 8 consecutive annual years of positive return with the last negative year being 2015. While this ride has been incredible for investors, we need to be careful not to get complacent – what goes up, also comes down, and we need to always be prepared to withstand a down year!
We hope you enjoyed going through the Tracker. Every week, we will be adding more data to this Tracker. If you would like to see any particular information added, do leave a comment!


0 Comments